- Post History
- Subscribe to RSS Feed
- Mark as New
- Mark as Read
- Bookmark
- Subscribe
- Printer Friendly Page
- Report Inappropriate Content
on 07-05-2022 09:28 AM

Do you currently manage space and power capacity for your server racks in ServiceNow?
If your answer is no or you can't answer this question I highly suggest you continue to read this article and watch the video. ServiceNow offers a variety ways to view and do some management of your equipment out of the box with the model form, workspace, dashboard, and dependency views.

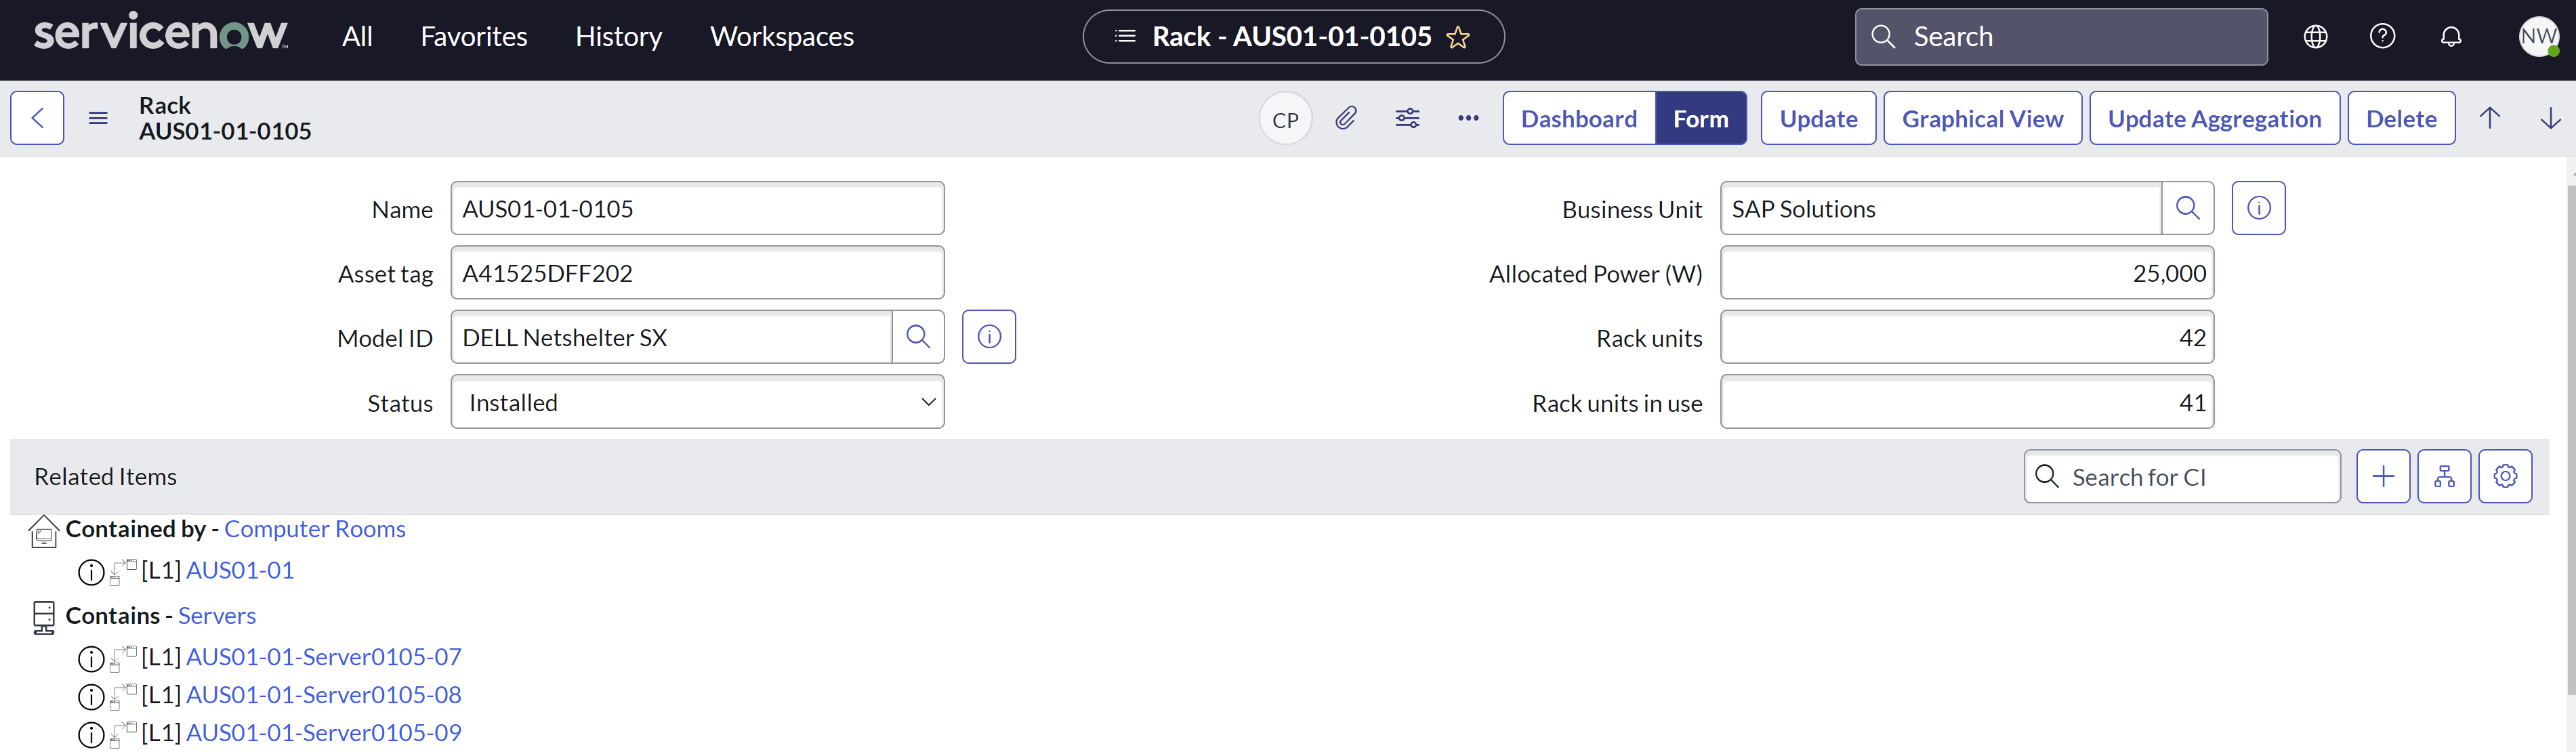
In the image above you can see the rack details in ServiceNow. You have fields that can be used, managed, and configured yourself to track space and power. The rack units, rack units in use, and allocated power have to be manually maintained by someone.
As you make changes to relationships by adding and removing equipment to racks, such allocations in space and power should be tracked automatically. Furthermore, while you see all relationships for everything contained in a rack, you do not see a visual representation of the rack to easily identify open spaces.
Needed: Rack Elevation Views with Power and Space Aggregations
Here is a video that will show a built on now application by Tier44 addressing this particular need.
In order to make this functionality work there are a couple of key elements required. First and foremost, the model is where all of the base information is kept such as rack units and power and the interface definitions. Second, you have to define the proper relationships with the contains::contained by and powers::powered by types using the interfaces as defined by the model.
Model Details
There are multiple elements that can be defined, the front and back image of the device, the allocated power value and the rack unit height. You can get these images from Tier44, which has a library of over five thousand images of equipment. The ru height is usually provided by the manufacturer, but if you use ServiceNow asset management you can get the number from there as well as a product number or you can fill it in yourself. The allocated power you can also maintain yourself by using either the value of the power supply or the derated value of the power supply. Another option is Tier44 who has a relationship with Groupware, now Trace3, that provides aggregations for customers that you can use for peak power allocation. the images. You can see this in the image below.

Relationships and Capacity Search
It is critical that your relationships are properly maintained and you use the contains::contained by and powers::powered by relationship type across the full tree to have automatic aggregation. Below you have a dependency view showing a top down structure from the global view to rooms, racks, all the way down to the equipment. Make sure you use the class independent relationship types and not the ones like room::room contains, or rack::rack contains for the automated aggregations to work.
With that said, the graphical view than can show you available capacity and space/power details on the right side updated automatically as you add and remove equipment from racks. You can search for the amount of space and power available. The color coding shows availability.

Request a Free Trial
By going to the ServiceNow Store, you can request a free trial of Tier44's Application. Visualize your data center and work flow today.
