- Post History
- Subscribe to RSS Feed
- Mark as New
- Mark as Read
- Bookmark
- Subscribe
- Printer Friendly Page
- Report Inappropriate Content
on 10-14-2016 09:46 AM - edited on 03-27-2026 08:11 AM by GTSPerformance
| < Previous Article | Next Article > | |
| Performance Maintenance and Administration | Maintaining Task table Growth |
This article was originally written in 2016 and many things have changed in ServiceNow since that time. The original goal of the article was to allow admins to extend one of the out-of-box Homepages in order to see high level system status information all in one place quickly. That method is now deprecated. As of March 2024 here are a couple alternatives to the original solution.
Instance Observer
Instance Observer is a purpose-built observability and monitoring tool that lets you trend and triage critical health metrics. It’s included with ServiceNow Impact, giving you a single pane of glass to manage the performance of all of your instances. This includes providing real-time instance telemetry as well as historical data so you can proactively identify trends and anomalies.
To see more about Instance Observer click here.
Monitoring XMLStats directly
Another possible alternative to the original solution from this article is to set up monitoring against the /xmlstats.do page. Note that you should be careful not to excessively query this page and you should use the "include" argument to only get the critical information you need to monitor.
Some examples:
xmlstats.do?include=system
- includes other includes
- system.memory
- replication
- transactions
- scheduled workers
- jvm
- discovery
- client metrics
xmlstats.do?include=servlet
- servlet.uptime: milliseconds since node restart
- servlet.metrics:
- <transactions> timing information for UI Pages, Lists, Forms, redirects (e.g. service_catalog.do). N.B. does not include SOAP, REST, (including all ServicePortal), AJAX, Angular, etc.)
- <sql_response> how long Java thinks* SQL is taking per query in milliseconds
- <job_times>job durations per span (1-minute, 5-minute, 15-minute)
- <processed_jobs> jobs processed per second
- ...lots more...
xmlstats.do?include=diagnostic_events
- plugin.activation – a plugin was activated
- cache.flush – all caches were flushed
- Node Start – current node restarts
- updateset.commit – update set commited on this node
- low.memory.remediation – node was running low on memory, could trigger transaction cancellation or restart
xmlstats.do?include=scheduler
- Background jobs (sys_trigger table)
- Each node claims ≈200 “Ready” jobs per 10 sec
- 8 “workers” (threads) per node process queued jobs
- queue.length: current number of jobs in queue
- mean.queue.age: average age of jobs in the queue – not including jobs that are currently running
- <scheduler.workers> status of each of the 8 “workers”
- current.job: Name of job running right now
- total.jobs: jobs processed on this worker since last restart
- mean.duration: average job processing duration since restart
xmlstats.do?include=semaphores
- max_queue_depth: highest peak queue depth ever
- name: name of the Semaphore “pool” (e.g. Default)
- queue_depth_limit: 150 for Default pool and 50 for other pools
- rejected_executions: How many transactions failed due to queue depth limit
- <semaphore>
- @age: milliseconds this transaction has been occupying the semaphore
- @processor: thread number
Introduction
NOTE: The "System Diagnostics" homepage and the "Cluster Node Status" UI Page have been deprecated since the San Diego release of ServiceNow. The following discussion about customizing the "Cluster Node Status" UI Page (diagnostics_cluster_nodes) is only relevant to customers who have the legacy homepage still intact and working. ServiceNow has upgraded to using Dashboards, not homepages and there are other better ways to get information about the status of your instance cluster. We have decided to keep this article live since some customers may still rely on the legacy behavior but it is no longer the recommended solution.
The "System Diagnostics" homepage comes out-of-the-box with ServiceNow and already provides many key metrics useful for quickly assessing instance health - like Java heap and permgen memory, MySQL threads, pending events, etc. To make the "System Diagnostics" homepage even more useful it can be extended to provide other useful pieces of information. There are endless customizations you could make to this homepage but for this post I will show you how to add semaphore stats. (To understand more about some of the key metrics that track performance in ServiceNow check out https://docs.servicenow.com/bundle/kingston-platform-administration/page/administer/core-configurati...)
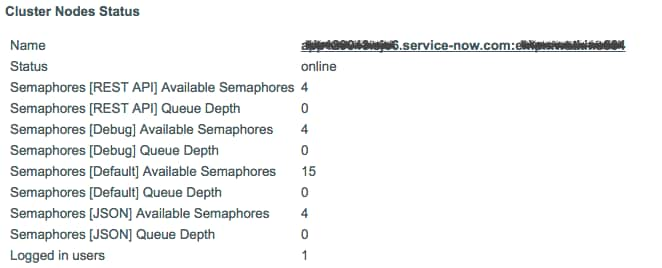
The "System Diagnostics" homepage is created from a widget called "Diagnostics". It picks up any UI Page whose name starts with the prefix "diagnostic_". The first gauge on the "System Diagnostics" homepage is the "Cluster Node Status". It is created by a UI Page called "diagnostic_cluster_nodes" and contains, as one might expect, the status of each node in the cluster. The way the UI Page works is that it pulls the whole <your instance>.service-now.com/xmlstats.do page into an XML object created by the "Diagnostics" Script Include. It then selects the items from that object that it wants to use. Since semaphore stats are part of xmlstats, we've just got to grab the items we want out of the Diagnostic object and add them to the output object.
Add Semaphore Availability and Queue Depth metrics to the "System Diagnostics" homepage
1) Open the UI page called "diagnostics_cluster_nodes"
2) In the HTML field (directly before the line "var ss = diagNode.stats.sessionsummary;") add the following code
var semaps = diagNode.stats['semaphores'];
for (var idx in semaps) {
var semap = semaps[idx];
var poolName = "Semaphores [" + semap["@name"] + "] ";
addValueToJSON(vals, poolName + "Available Semaphores", semap["@available"]);
addValueToJSON(vals, poolName + "Queue Depth", semap["@queue_depth"]);
}
3) Click "Update" NOTE: If you don't want to alter the out-of-box UI Page what you could do is make a copy of the page and give it a slightly different prefix (e.g. "my_diagnostic_cluster_nodes") and then also copy the widget called "Diagnostics" and just change line 11 that adds the UI Pages to include "my_diagnostic" as the prefix instead.
Here's a screenshot of what it looks like:

Add Scheduled Job information to the Diagnostics Homepage
If you want to add a section with the status of all your scheduler jobs, including what job is running, how long it has run, and when it started use the following:
//Custom section for scheduler workers
var workerpool = diagNode.stats['scheduler.workers'];
for (var idw in workerpool) {
    var details = [];
    var worker = workerpool[idw];
    for (var wDetail in worker) details.push(wDetail + ": " + worker[wDetail]);
        addValueToJSON(vals, idw, details.join(",   "));
}
It will output results like the following for each node:

Create Diagnostic Conditional Formatting Rules - (i.e. turn something red when it crosses a threshold)
One more thing. Some of the diagnostic values turn red when a certain condition is met. This can also be customized. The way to do it is to create (or update) one of the sys_properties records that start with the prefix "diagnostics.condition.". The "value" field of these properties expects a javascript snippet that, when evaluated, will return true or false if the given diagnostic matches the condition.
So, for the sake of demonstration, suppose I create a sys_properties record with name "diagnostics.condition.system.memory.in.use" with value "> 200" (without the quotes, of course). In reality, you would want to set the threshold much higher (like 1800 or 90%) as 200 MB in use is very low - only 10%. Before anything will happen I need to set up the Cluster Diagnostics page to pass in my new diagnostic condition value. To do this I change line 79 of UI Page "diagnostic_cluster_nodes" from:
79: addValueToJSON(vals, "Memory (MB)", diagNode.stats['system.memory.in.use'] + " of " + maxMemory);
to:
79: addValueToJSON(vals, "Memory (MB)", diagNode.stats['system.memory.in.use'], jelly.jvar_diag.conditions['system.memory.in.use']);
Then, if Java heap memory goes over 200MB the diagnostic output will turn red like this:

Additional Notes:
The Diagnostics() javascript class that powers the Diagnostics Homepage pulls from the sys_cluster_state table. The sys_cluster_state table has a field named "stats" that has the XML formatted data similar to what is on the xmlstats.do page. Therefore you can add anything to the Diagnostics Homepage that you can see in the /xmlstats.do page. However, xmlstats.do DOES NOT PULL most of its information from the database and therefore has much less impact on performance and a better choice for any monitoring type solutions. Pulling data from sys_cluster_state is non-trivial and has potential performance ramifications if done too frequently.
In instances running Helsinki and later, the UI Page is called "diagnostic_cluster_nodes".
This document was generated from the following discussion: How can I see statistics (xmlstats.do & stats.do) for all my nodes?
| < Previous Article | Next Article > | |
| Performance Maintenance and Administration | Maintaining Task table Growth |
- 25,457 Views
- Mark as Read
- Mark as New
- Bookmark
- Permalink
- Report Inappropriate Content
Re the Memory shown in this screen shot example, is that showing memory used by the instance, or available to the instance?
Thanks
- Mark as Read
- Mark as New
- Bookmark
- Permalink
- Report Inappropriate Content
That is Megs of memory currently in use out of a total available 2000 Megs.
- Mark as Read
- Mark as New
- Bookmark
- Permalink
- Report Inappropriate Content
Also if using xmlstats.do for monitoring you should limit the output to just the "includes" that you need. This can be by adding ?include=X in the URL. You can have multiple includes by separating them with commas.
Some examples:
xmlstats.do?include=system
- includes other includes
- system.memory
- replication
- transactions
- scheduled workers
- jvm
- discovery
- client metrics
xmlstats.do?include=servlet
- servlet.uptime: milliseconds since node restart
- servlet.metrics:
- <transactions> timing information for UI Pages, Lists, Forms, redirects (e.g. service_catalog.do). N.B. does not include SOAP, REST, (including all ServicePortal), AJAX, Angular, etc.)
- <sql_response> how long Java thinks* SQL is taking per query in milliseconds
- <job_times>job durations per span (1-minute, 5-minute, 15-minute)
- <processed_jobs> jobs processed per second
- ...lots more...
xmlstats.do?include=diagnostic_events
- plugin.activation – a plugin was activated
- cache.flush – all caches were flushed
- Node Start – current node restarts
- updateset.commit – update set commited on this node
- low.memory.remediation – node was running low on memory, could trigger transaction cancellation or restart
xmlstats.do?include=scheduler
- Background jobs (sys_trigger table)
- Each node claims ≈200 “Ready” jobs per 10 sec
- 8 “workers” (threads) per node process queued jobs
- queue.length: current number of jobs in queue
- mean.queue.age: average age of jobs in the queue – not including jobs that are currently running
- <scheduler.workers> status of each of the 8 “workers”
- current.job: Name of job running right now
- total.jobs: jobs processed on this worker since last restart
- mean.duration: average job processing duration since restart
xmlstats.do?include=semaphores
- max_queue_depth: highest peak queue depth ever
- name: name of the Semaphore “pool” (e.g. Default)
- queue_depth_limit: 150 for Default pool and 50 for other pools
- rejected_executions: How many transactions failed due to queue depth limit
- <semaphore>
- @age: milliseconds this transaction has been occupying the semaphore
- @processor: thread number
Please ✅ Correct if this solves your issue and/or 👍 if Helpful
- Mark as Read
- Mark as New
- Bookmark
- Permalink
- Report Inappropriate Content
diagnostics_cluster_nodes does not exist on our production instance