- Post History
- Subscribe to RSS Feed
- Mark as New
- Mark as Read
- Bookmark
- Subscribe
- Printer Friendly Page
- Report Inappropriate Content
on 03-19-2020 10:38 AM
Strategies for reporting in ServiceNow
The core reporting capability in ServiceNow is excellent, it’s straight forward and intuitive to create consistent looking reports using any data in the Now platform. Importantly, the underlying data is available to help address concerns over accuracy, and security is managed at the platform level which means you can be confident in who can access what information.
However, it can be perceived as having some limitations. Some of the frequent complaints I hear are:
- you cannot perform calculations like in a spreadsheet
- you cannot summarise multiple data sources directly.
None of these are insurmountable but they do require that reporting be considered differently and not just an after-thought.
Below are some of the strategies I’ve used to help overcome some of these limitations and address other needs.
Calculations
The lack of spreadsheet like formula in reports is an annoyance but totally understandable. Of course, fields can contain a calculated value, configured in the advanced view on a dictionary. However, calculations are evaluated every time a row is read. Each calculation on its own may be insignificant but consider evaluating for every row shown in a list with multiple users looking at the same list. It can start to have a negative impact performance. Furthermore, you cannot filter on or report on calculated values.
It’s important to think about the ServiceNow way to achieve results and not just apply an approach used elsewhere. The ServiceNow strategy is to use business rules to set values in a table as they change in a process, that means the process solely responsible for its own data and helps to ensure a single source of truth.
The right kind of calculations
Of course, adding lots of new fields directly to tables isn’t always the right thing to do and often there are better places or ways to perform some common calculations.
Metrics are used to show the effectiveness of a process but they could be used for pretty much any calculation. Metrics are commonly a duration; an example use cases is to record the time a task is with an assignment group or in each state. There’s even a timeline to visualise this data from a task. Metrics can store any value and when the type is changed to script calculation you can start to derive other metrics, default calculated metrics included identifying if an incident is resolved by a known error.
Metrics themselves store values in a single table, the metric instances. Reporting on this itself can sometimes be a challenge but we’ll come to that shortly.
Many people already make use of assessments, these are comprised of assessment metric which can be scripted to retrieve data from the Now platform. These need assessments to be triggered to capture the assessment metrics so are not ideal for every scenario but can be useful to run on a schedule or when something else in the platform has triggered a change of state.
Many people make use of SLA’s but SLA Breakdowns are also part of the platform which is often overlooked. Introduced in London, SLA Breakdowns store details such as the assigned to or assignment group and the proportion of the business elapsed time each account for. This gives an incredibly useful source of data, looking just at the sla_breadkdown_by_assignment_gorup table you can start to see the impact of assignment group transfers on the SLA and build reports around this data.

Formatting data
So, there’s a big pool of data, but it may not be in format which lends itself to the kind of report you need to present. Once again, there are a few approaches to reformat data.
If there is data in few tables and you just need to join these into one, database views are a good place to start when you are not able to dot walk via reference fields to other tables. The platform uses a number of these by default, for example the incident_metric view joins the metric_instance, metric_definition and incident table so reports on incident metrics have access to many of the incident fields.
Database views obey security and ACL’s set on the underlying tables, and can have supplemental ACL’s added if necessary. If you add fields to the incident table these may not always be on database view, remember to check the definition.
As database views don’t typically use reference fields performance needs to be monitored in the slow query log. Always ensure the fields used in the join condition are indexed and avoid unnecessary complexity in conditions, OR conditions in particular tend to affect performance but there are ways to address these performance issues.
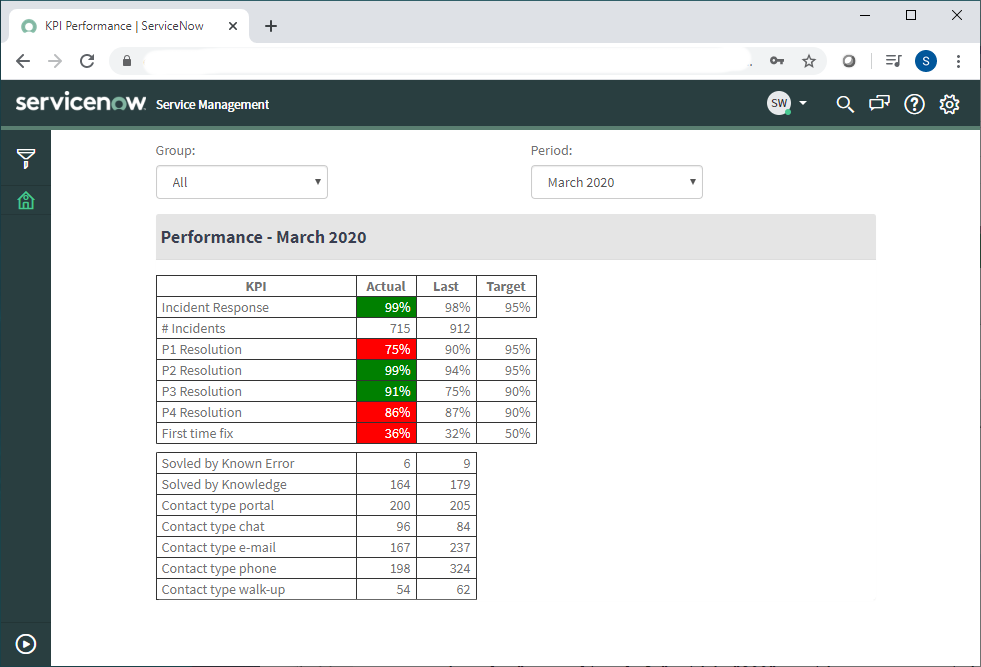
Often, I find that database views just don’t allow the flexibly needed and data needs to be held in a totally different format. As an example, a customer needed to see the performance of a combination SLA’s and metrics against defined targets.
|
SLA |
P1 |
99% in SLA |
|
SLA |
P2 |
95% in SLA |
|
SLA |
P3 |
90% in SLA |
|
Metric |
First time fix |
25% |
|
Metric |
Assignment group transfers |
Max 5% |
The is effectively cubing data as would be done in a data warehouse, so it’s a custom table. How the table is populated depends very much on the data, it could be scheduled to update, it could be on-demand or with the flexibly of the Now platform business rules can dynamically update this summary tables. In this example, if it had only been SLA performance against target, Performance Analytics and goals might be a better choice.
Visualisation
The above strategies should provide some guidance to help with preparing data but sometimes the presentation or format of reports just can’t be achieved with the baseline tools.
The most common question I am asked is can ServiceNow create a reporting pack combing many reports that can be e-mailed out. The default position on this should always be no, nor should it. As has been written about many times in the past, as soon as data is outside of the Now platform it’s out of date, distribution and access is no longer controlled, you’ve lost the single source of truth and likely any underlying evidence to back up a report. Multi-page reports themselves, that’s no problem. Dashboards really are a great way to combine multiple reports and give a single focal point while keeping everything in platform and current.
A final strategy when none of the above work is to create single page applications or reports using Service Portal, while this is a last resort it is one I find myself using more frequently. This approach unlocks the full potential of Angular and HTML while keeping data in the Now platform. Using custom widgets, data can be manipulated in any way and there are numerous existing libraries to visualise data which can be used in Service Portal, it’s possible to create pretty much any visualisation imaginable and even incorporate data from other systems. The caveat of this is a cost of ownership.

Most of the above suggestions can be completed by any ServiceNow administrator, building custom widgets usually needs people with specialist skills and it’s not usually a trivial undertaking. It is upgrade safe and is a pattern used frequently in ServiceNow created products but don’t jump straight to this approach, explore other options first.
External data
ServiceNow itself isn’t a data warehouse and shouldn’t be made into one. While it is easy to import data from other systems, it’s best to just import summary data which will add value. Don’t try to import millions of rows of data if the only metric you need to present is a summary showing number of rows per day. Performance Analytics also has a great feature to allow importing of external scores.
Data Exports
Keeping data in-platform is generally the preferred approach, there is a single source of truth, robust data structures and security controls to limit access to data. Sometimes, however, its necessary to get data out of ServiceNow and into other reporting tools to combine with other data sources. In a follow on-article I’ll discuss some strategies for this along with their pros and cons.
While reporting in platform may appear quite limited at first, using some of the wider features provided by the Now platform can introduce a lot of flexibility.
- 5,109 Views
- Mark as Read
- Mark as New
- Bookmark
- Permalink
- Report Inappropriate Content
Thanks for sharing that. Dont forget that reporting in the wrong hands can do some crazy things 🙂
Always include time boxing and other indexed fields to reduce data set as much as possible before doing any complex calculations or using the dreaded "contains" operator.
A mentor also once told me, never approach a report without first having a very crisp question that the data will answer. Without that you may face a result set which will always be the "right" answer, but you may have asked the wrong question :).
Happy reporting to all!
- Mark as Read
- Mark as New
- Bookmark
- Permalink
- Report Inappropriate Content
- Mark as Read
- Mark as New
- Bookmark
- Permalink
- Report Inappropriate Content
Great question Dan. You can report on remote tables but as the data is stored in memory they shouldn't be really be used for data sets with over 1000 rows. As the data is populated by script, they do open up some new interesting possibilities but with size limits my preference is to store data in traditional persistent tables.