- Post History
- Subscribe to RSS Feed
- Mark as New
- Mark as Read
- Bookmark
- Subscribe
- Printer Friendly Page
- Report Inappropriate Content
on 12-23-2019 09:49 AM
Service Now Reports

Report options available
 |
|
Report View


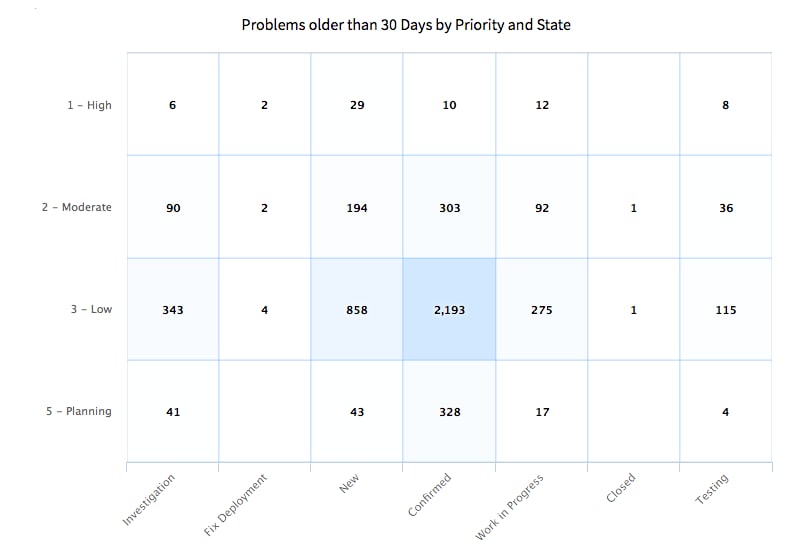
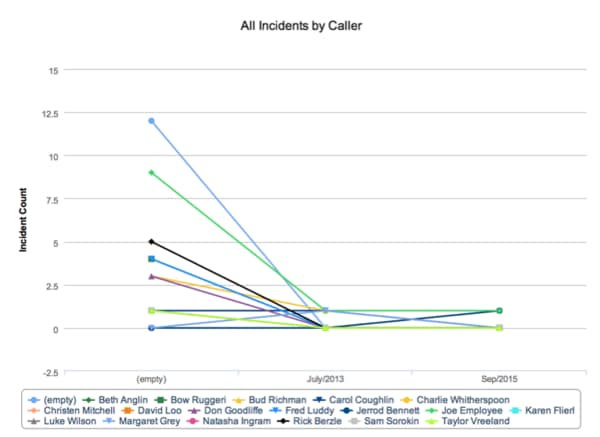
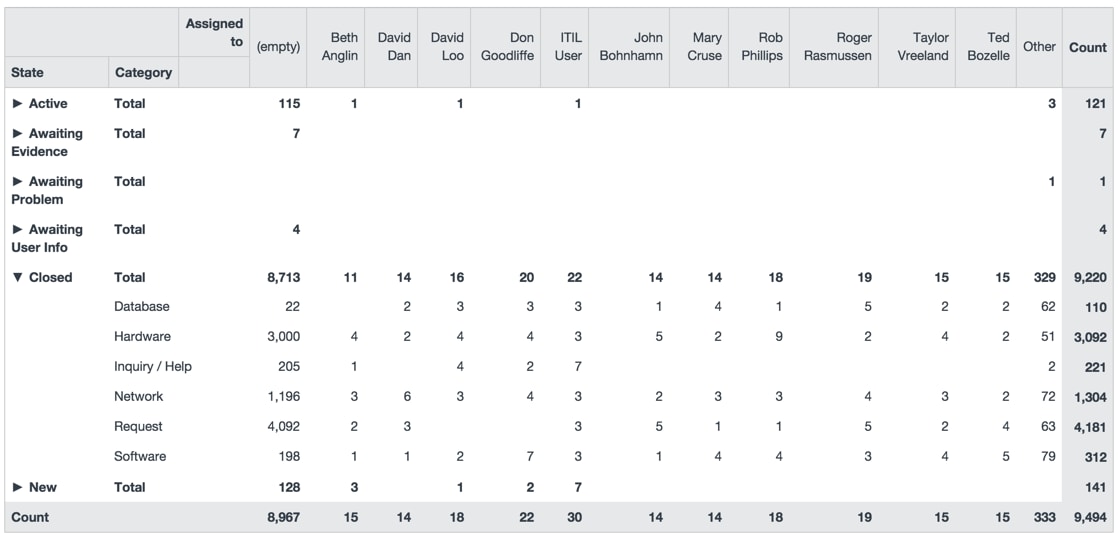
From Data Visualization
Report types
| Type | Image |
Description |
 |
| |
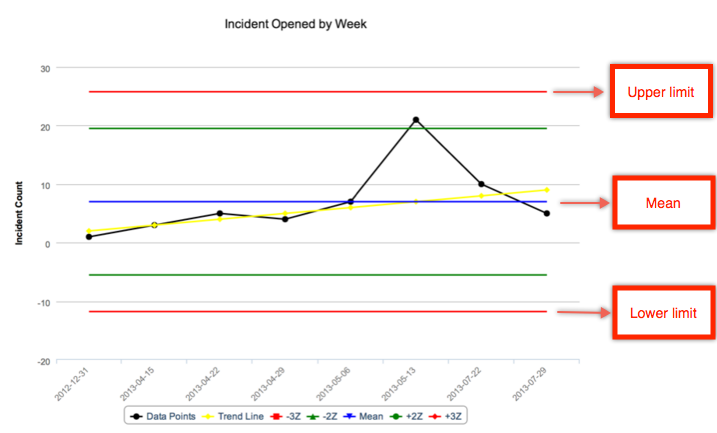
| Time Series Charts |  |
|
| Time Series Charts |  |
|
| Time Series Charts |  |
|
| Time Series Charts |
| |
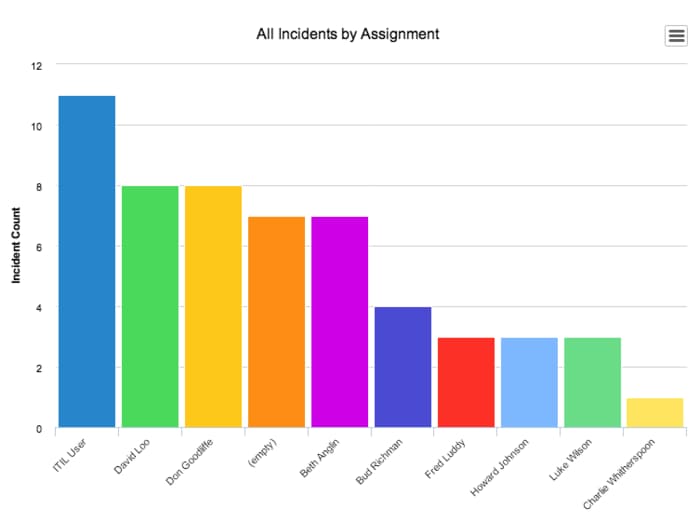
| Column and Bar Charts |  |
|
| Column and Bar Charts |  |
|
| Column and Bar Charts |
| |
| Pies |  |
|
| Pies |  |
|
| Dials |  |
|
| Dials |  |
|
| Dials |  |
|
| Dials |  |
|
| Dials |  |
|
| Dials |  |
|
| Dials |  |
|
| Others |  |
|
| Others |  |
|
| Others |  |
|
| Others |  |
|
| Others |
| |
| Others |  |
|
| Others |  |
|
| Others |  |
|
The Most Used tables
- incident
- sc_req_item
- problem
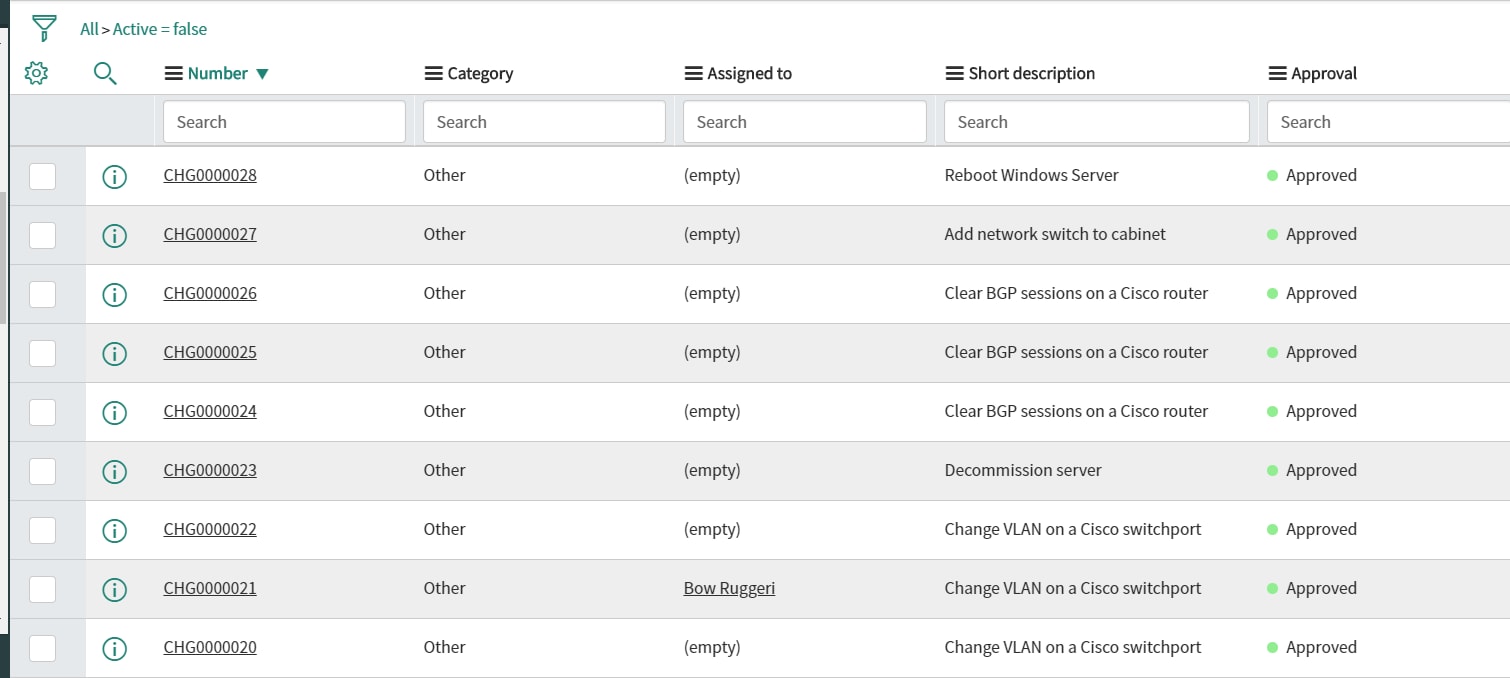
- change_request
- change_task
- cmdb_ci
- task_sla
- sc_cat_item
How to Create a New Report
| Image | Description |
 |
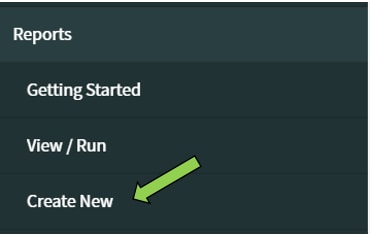
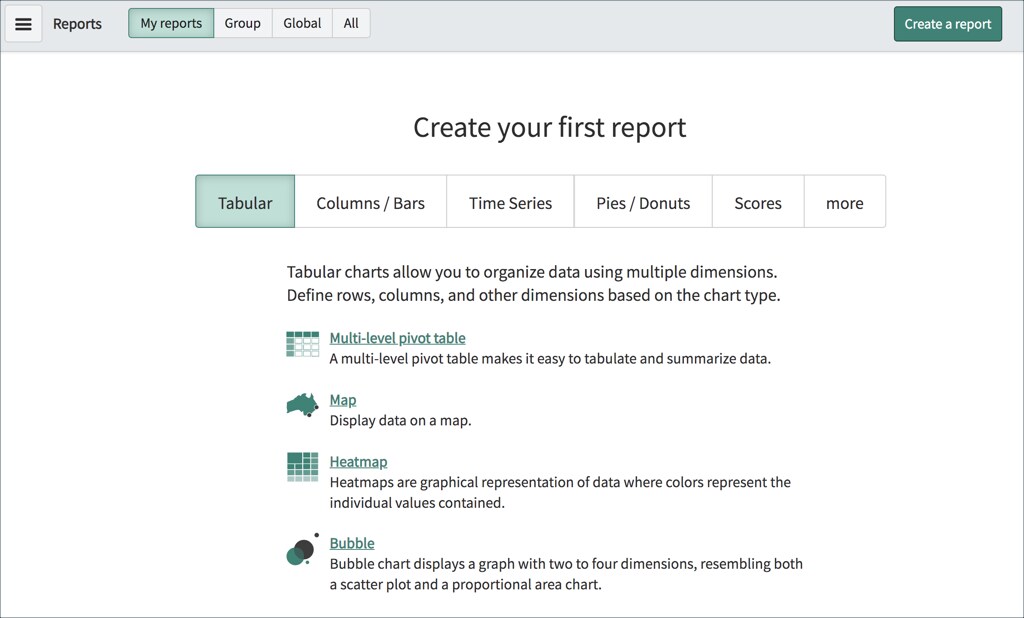
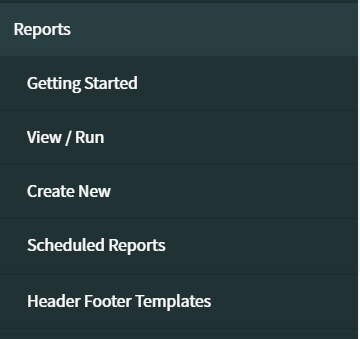
01. Report Menu >> Reports > Create New
Para criar um novo relatório, navegue pelo menu Relatórios -> Criar Novo: |
 |
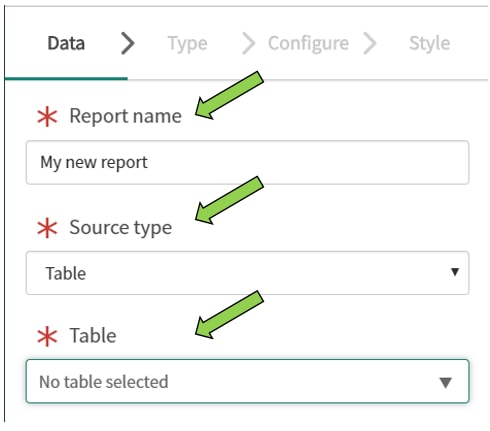
02. Choose your report name, source type and table.
O primeiro passo, é informar o Nome para o relatório, informar o Tipo de Origem (Tabela) e informar o nome da Tabela que possui os dados que deseja, depois clique em Avançar:
|
 | 03. Next |
 |
04. Select the report Type and click Next
O segundo passo, é escolher o Tipo de Relatório que deseja criar e depois clique em Avançar: |
 |
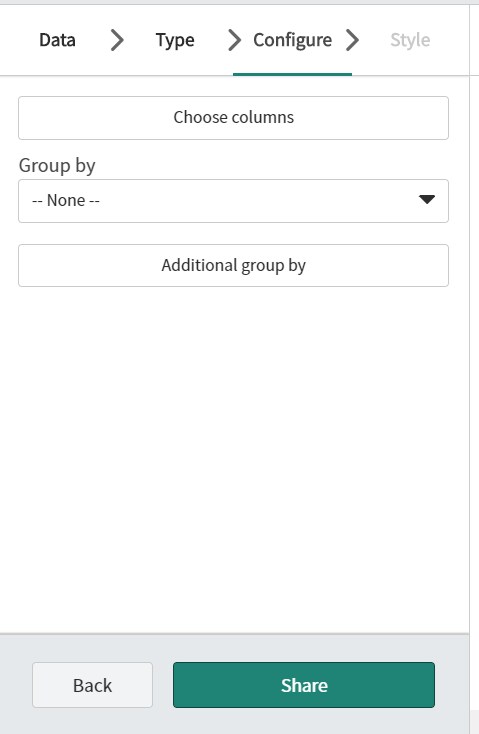
05. Choose Columns and Additional Group By (if.. is it your case?)
O terceiro passo, é informar quais colunas serão utilizadas no relatório e se haverá agrupamento |
 | 06. Run |