- Mark as New
- Bookmark
- Subscribe
- Mute
- Subscribe to RSS Feed
- Permalink
- Report Inappropriate Content
11-12-2019 01:49 AM
Hi,
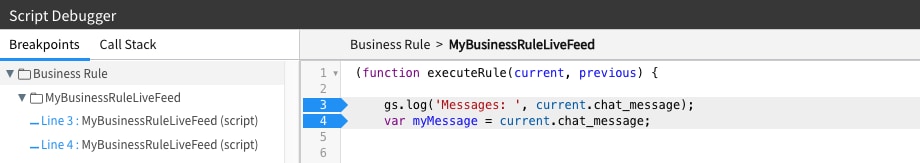
While trying to debug the business rules script the script debugger is not responding.
I have placed the code in business rules > script pane. The condition is placed to trigger business rule is implemented 'after database Insert' on 'live_message'.
Since last successful update of Madrid. Debugger is not working properly. Breakpoints are not able to pause the flow of execution.
Kindly help.
Regards
aj
Solved! Go to Solution.
- Labels:
-
Scripting and Coding
- Mark as New
- Bookmark
- Subscribe
- Mute
- Subscribe to RSS Feed
- Permalink
- Report Inappropriate Content
03-14-2020 01:18 PM
I have a script include in a scoped app that I used to be able to step through in the debugger and now the Debugger just sits at Status: WAITING_FOR_FIRST_BREAKPOINT user: System Administrator.
I read in Doc's that it will work if isInteractive() is true
var interActive = gs.getSession().isInteractive();
gs.info(interActive);
When I run this in scripts background, it says false. I know I used to be able to call this and step through, any suggestions or ideas?
Just created this test in a scoped app:
created basic script include and set accessible from "all application scopes"
name: test
script:
function test() {
	return 'hello world';
}

// called from scripts backgroun in the same scope
gs.info(test());  // hello world
launched script debugger from the script include, added break point and it never stops at breakpoint
- Mark as New
- Bookmark
- Subscribe
- Mute
- Subscribe to RSS Feed
- Permalink
- Report Inappropriate Content
11-12-2019 02:06 AM
- Mark as New
- Bookmark
- Subscribe
- Mute
- Subscribe to RSS Feed
- Permalink
- Report Inappropriate Content
11-12-2019 02:23 AM


- Mark as New
- Bookmark
- Subscribe
- Mute
- Subscribe to RSS Feed
- Permalink
- Report Inappropriate Content
11-12-2019 02:38 AM
It seems the business rule creation has changed in comparison to what is mentioned in the docs https://developer.servicenow.com/app.do#!/training/article/app_store_learnv2_scripting_madrid_server...
Current UI & Options

- Mark as New
- Bookmark
- Subscribe
- Mute
- Subscribe to RSS Feed
- Permalink
- Report Inappropriate Content
02-13-2020 05:43 AM
I am having the exact same issue that AJ is having.
I have followed these steps exactly.. and still no luck.
Note: The Script Include is working properly.. and is triggered by the BR as intended.
This is even for a simple "hello world" scenario.. just to avoid having too many moving pieces to worry about.
Code works.. Debugger does not.
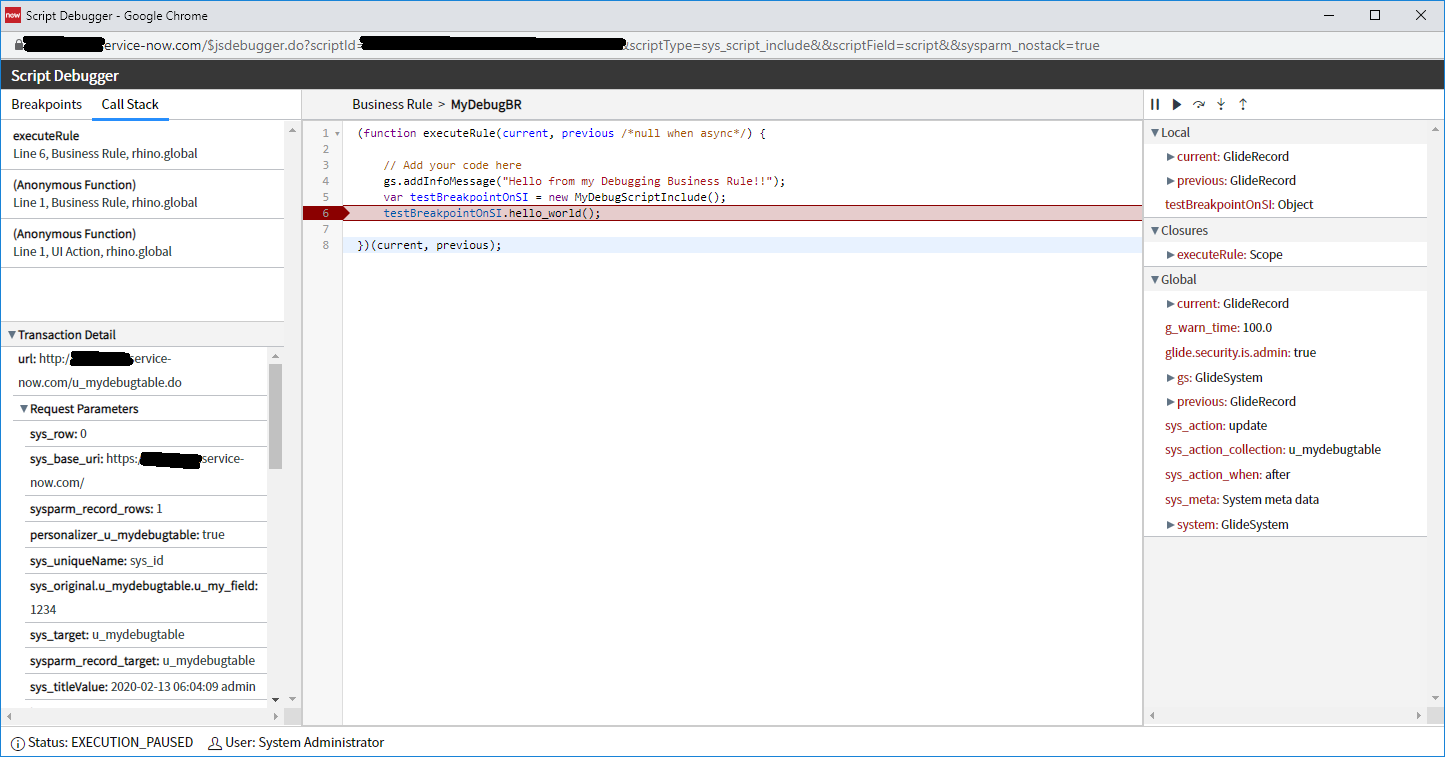
Update: I just tried this on a Free Developer Instance.. and it works as intended...
But it does NOT work on our Project's Dev Instance... /shrug
Free Dev Instance Screen shot (showing things working)
