- Mark as New
- Bookmark
- Subscribe
- Mute
- Subscribe to RSS Feed
- Permalink
- Report Inappropriate Content
11-22-2017 11:33 AM
HI All,
I'm trying to create two reports on SLA,
Report .1 :
| An ITIL user must be able to report on the percentage of incidents resolved within agreed Resolution SLA by Priority |
Report should look something like this,

Report.2 :
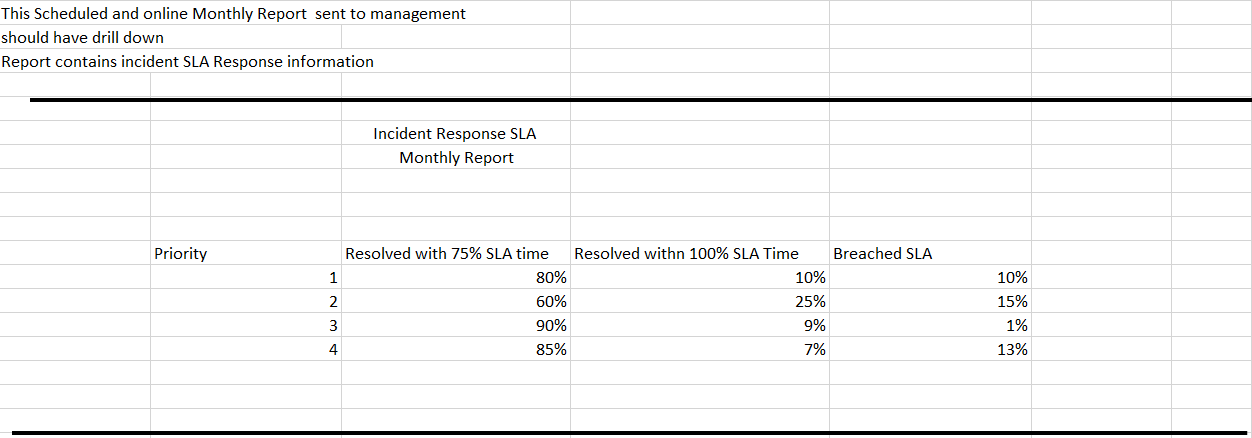
| An ITIL user must be able to report on the percentage of incidents that were acknowledged within agreed Response SLA by Priority |
Report should look something like this,

I'm unsure of how to represent the report with 75 % and 100 % time frame.
FYI - I'm running the report on task_sla table.
Solved! Go to Solution.
- Mark as New
- Bookmark
- Subscribe
- Mute
- Subscribe to RSS Feed
- Permalink
- Report Inappropriate Content
11-22-2017 02:49 PM
David,
Check out the Report Ranges feature. The idea with that is you can create your own groupings for any field on a table. It looks like this after you set it up.
One thing I do want to point out is that, because this is an SLA report, don't misinterpret what these percentages are showing you. These are percentages of task_sla records, not of Incidents, so don't just copy that % number over and call it good. There are also situations, depending on the SLA definition, where an Incident may not get an SLA attached to it at all, and thus, wouldn't show up in a report like this.
You'll definitely need to tinker with it but this will probably get you closer to where you want to be. See the attached PDF as an example.
- Mark as New
- Bookmark
- Subscribe
- Mute
- Subscribe to RSS Feed
- Permalink
- Report Inappropriate Content
11-22-2017 04:40 PM
Hi Patrick,
Thank you !!
I think I'm very close to the report just wanted to clarify few things before I proceed.
My assumption is group by business elapsed percentage will give me a report for resolution SLA and group by actual elapsed percentage will give me a report for response SLA.
since I need two reports one for resolution and one for response SLA.
Can you please advise.
- Mark as New
- Bookmark
- Subscribe
- Mute
- Subscribe to RSS Feed
- Permalink
- Report Inappropriate Content
11-22-2017 07:31 PM
I'm not sure if you are saying you want to track the response/resolution SLAs together (like, treat them as a single SLA), or if you are saying you should use business % for the resolution SLA, and actual % for the response SLA.
In either case, you should track the response SLA by itself, and the resolution SLA by itself. The decision to use business or actual % elapsed will be decided by your company when they decide what they want to see. My opinion is that, unless the SLA is intended to be executed on a 24/7 basis, as opposed to business hours, then just stick to business % so you can show a number that takes the SLA's schedule into account.
Read more about actual/business time here: https://docs.servicenow.com/bundle/istanbul-it-service-management/page/product/service-level-managem...
- Mark as New
- Bookmark
- Subscribe
- Mute
- Subscribe to RSS Feed
- Permalink
- Report Inappropriate Content
12-19-2017 06:34 PM
Hi Patrick
could you share the screen shot how you did this report?