- Mark as New
- Bookmark
- Subscribe
- Mute
- Subscribe to RSS Feed
- Permalink
- Report Inappropriate Content
11-22-2017 11:33 AM
HI All,
I'm trying to create two reports on SLA,
Report .1 :
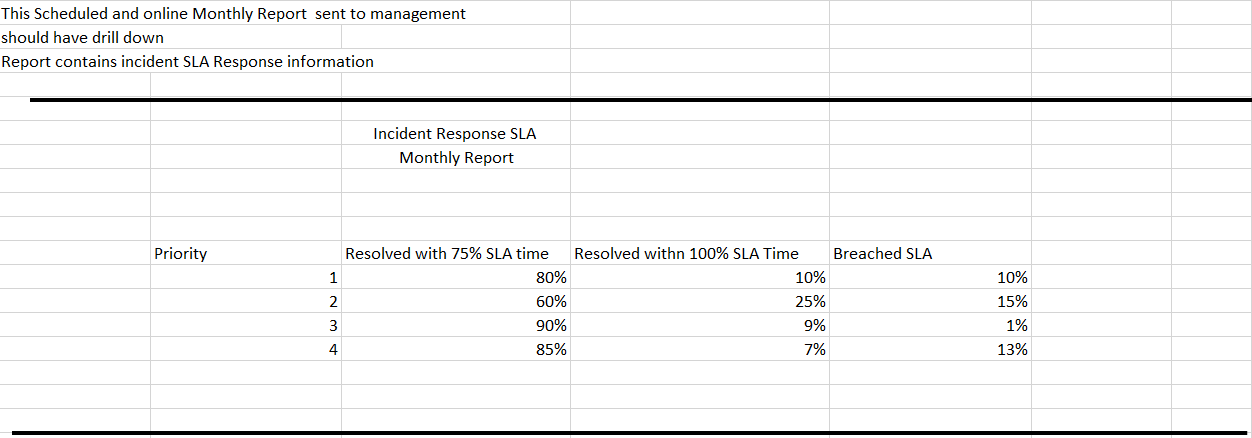
| An ITIL user must be able to report on the percentage of incidents resolved within agreed Resolution SLA by Priority |
Report should look something like this,

Report.2 :
| An ITIL user must be able to report on the percentage of incidents that were acknowledged within agreed Response SLA by Priority |
Report should look something like this,

I'm unsure of how to represent the report with 75 % and 100 % time frame.
FYI - I'm running the report on task_sla table.
Solved! Go to Solution.
- Mark as New
- Bookmark
- Subscribe
- Mute
- Subscribe to RSS Feed
- Permalink
- Report Inappropriate Content
11-22-2017 02:49 PM
David,
Check out the Report Ranges feature. The idea with that is you can create your own groupings for any field on a table. It looks like this after you set it up.
One thing I do want to point out is that, because this is an SLA report, don't misinterpret what these percentages are showing you. These are percentages of task_sla records, not of Incidents, so don't just copy that % number over and call it good. There are also situations, depending on the SLA definition, where an Incident may not get an SLA attached to it at all, and thus, wouldn't show up in a report like this.
You'll definitely need to tinker with it but this will probably get you closer to where you want to be. See the attached PDF as an example.
- Mark as New
- Bookmark
- Subscribe
- Mute
- Subscribe to RSS Feed
- Permalink
- Report Inappropriate Content
12-19-2017 07:59 PM
Sure. It's just a bar chart report on Task SLA, grouped by Business elapsed percentage, and stacked by Task.Priority. The key reason this report looks the way it does is because of the Report Ranges feature, which lets you define the thresholds for a given group. In this example, I said that 75% or less is one group, 75-100% is another group, and anything more than 100% is the 3rd group. You can use more than 3 groups if you want yours grouped more specifically than that.


- Mark as New
- Bookmark
- Subscribe
- Mute
- Subscribe to RSS Feed
- Permalink
- Report Inappropriate Content
12-20-2017 01:37 AM
Thanks Parick,
could you also click into one range, and paste the screen shot for the detail? from my side, the report range doesn't work. Not sure why.
- Mark as New
- Bookmark
- Subscribe
- Mute
- Subscribe to RSS Feed
- Permalink
- Report Inappropriate Content
12-20-2017 05:22 AM
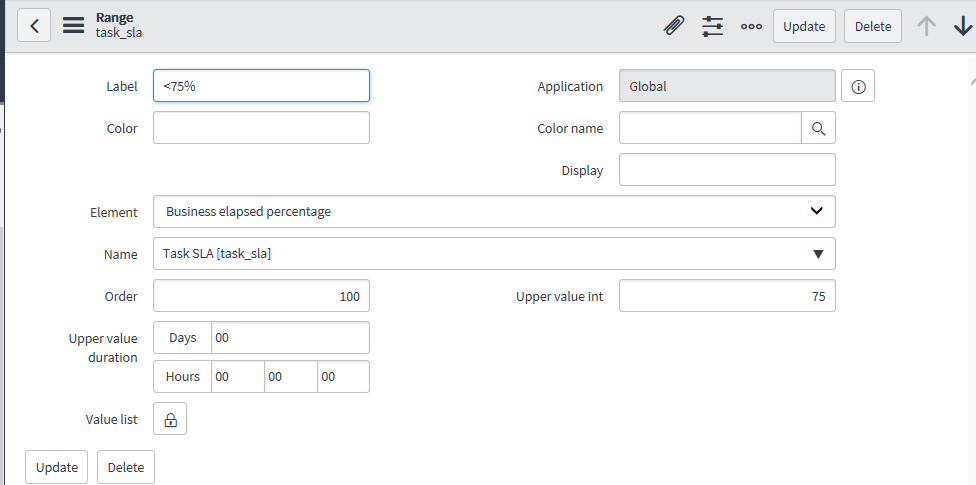
You only have to specify these attributes to get it to work correctly:
1. Name: This is the table name - task_sla
2. Element: I chose business_percentage, but you could choose a different field if that's not what you want in the report.
3. Label: type in whatever you want this grouping to show as in the report.
4. Upper value int: the upper threshold for this range. This screenshot shows 75, so this range includes every number up to 75. The next report range after it specifies 100 (so the 75-100 range).

- Mark as New
- Bookmark
- Subscribe
- Mute
- Subscribe to RSS Feed
- Permalink
- Report Inappropriate Content
12-20-2017 06:37 PM
- Mark as New
- Bookmark
- Subscribe
- Mute
- Subscribe to RSS Feed
- Permalink
- Report Inappropriate Content
11-03-2020 12:46 AM
Hi patrick,
the post is old, but I would like to know how you managed to generate this report 🙂
Thank you