


mitchellstutler
Tera Contributor
Options
- Subscribe to RSS Feed
- Mark as New
- Mark as Read
- Bookmark
- Subscribe
- Printer Friendly Page
- Report Inappropriate Content
09-21-2016
07:55 AM
This post is going to build on my previous post. If you are wanting to follow along in your own instance you will probably have an easier time if you work through the first post before beginning this one.
In this post we will learn how to set up widget options and retrieve data from the server script. By the end of this we will have the tools we need to build configurable and dynamic widgets.
Widget options
Widget options allow you to set up configurable properties for individual instances of your widget. This gives you the ability to use the same widget across multiple pages or even portals while still giving you the flexibility to customize those instances of the widget.
To set our widget options up there will be 3 main steps: create the option schema, set default values for these options in our server script, and using these options in our client script.
From the widget editor, click the hamburger menu near the top right and select 'Edit option schema'. This gives us a modal that allows to create, modify, or delete options for our widget. In this example we will set up 3 options: Width, Bar Height, and Left Margin. Click the "+" button to add a new option and then give each of these options a type of "integer". Here is a screenshot of my option schema:
Now that we have these options, we will use our server script to set default values in case the user doesn't need to customize their widget instance. Below is the portion of our server script that accomplishes the default values. Later in this post I will post the complete server script, but for now we will just enter this code at the beginning of our server script function.
// Set default options
options.width = options.width || 600;
options.bar_height = options.bar_height || 20;
options.left_margin = options.left_margin || 100;
These 3 lines check if there is a value for these options and sets to our default values if not.
Now that we have an option schema configured and are protected with default values, we can reference these options in our client script. The data and options objects are available to us in the client script by prefixing them with c like this "c.options.width". I will paste the full client script in a later section. For now, here are the lines that set our variables to our options so that we can easily reference them later.
// Set the width of the chart along with the height of each bar
var width = c.options.width,
barHeight = c.options.bar_height,
leftMargin = c.options.left_margin;
Server script
Now that we have properties set up let's work on dynamically pulling data from ServiceNow. In the previous post, we used hard-coded data to generate our bar chart. This time we will use a GlideAggregate call to grab the number of incidents in each category. If you aren't familiar with GlideAggregate check out its page on the Product Documentation Site.
The first thing we'll do is declare an array of objects within the data object:
data.categories = [];
Next, we'll make our GlideAggregate call and create an object within the array for each of the incident categories that are returned.
var count = new GlideAggregate('incident');
count.addQuery('active', 'true');
count.addAggregate('COUNT', 'category');
count.query();
while (count.next()) {
var category = count.category.getDisplayValue();
var categoryCount = count.getAggregate('COUNT', 'category') * 1.0;
data.categories.push({"category": category, "value": categoryCount});
}
We now have an array of objects that we can reference in our client script. Here is a screenshot of our server script along with the complete script pasted.
(function() {
/* populate the 'data' object */
// Set default options
options.width = options.width || 600;
options.bar_height = options.bar_height || 20;
options.left_margin = options.left_margin || 100;
// Create an array of objects containing the categories along with
// the number of objects in each
data.categories = [];
var count = new GlideAggregate('incident');
count.addQuery('active', 'true');
count.addAggregate('COUNT', 'category');
count.query();
while (count.next()) {
var category = count.category.getDisplayValue();
var categoryCount = count.getAggregate('COUNT', 'category') * 1.0;
data.categories.push({"category": category, "value": categoryCount});
}
})();
Client script
In the last post we had a variable named "data" that we had set equal to a hard-coded array of objects in our client script. This time we will set that same variable equal to our array of objects that we created in our server script. Here is the line of code that accomplishes this:
// Define our hard-coded data
var data = c.data.categories;
Other than that and the options that we set up earlier, the main new piece introduced is the bottom axis. We add that in with these lines:
// Create the x-axis and append it to the bottom of the chart
var xAxis = d3.axisBottom().scale(x);
chart.append("g")
.attr("class", "x axis")
.attr("transform", "translate(0," + (barHeight * data.length) + ")")
.attr("x", leftMargin)
.call(xAxis);
Below is a screenshot of our client script as well as the pasted script.
function() {
/* widget controller */
var c = this;
// Define our hard-coded data
var data = c.data.categories;
// Set the width of the chart along with the height of each bar
var width = c.options.width,
barHeight = c.options.bar_height,
leftMargin = c.options.left_margin;
var chart = d3.select(".chart")
.attr("width", width)
.attr("height", barHeight * data.length + 50);
// Set the domain and range of the chart
var x = d3.scaleLinear()
.range([leftMargin, width])
.domain([0, d3.max(data, function(d) { return d.value; })]);
// Add a g container for each row from our data
var bar = chart.selectAll("g")
.data(data)
.enter().append("g")
.attr("transform", function(d, i) { return "translate(0," + i * barHeight + ")"; });
// Add a rectangle element with the width based off of the value from that row of data
bar.append("rect")
.attr("width", function(d) { return x(d.value) - leftMargin; })
.attr("height", barHeight - 1)
.attr("x", leftMargin);
// Add text elements to serve as labels of our categories
bar.append("text")
.attr("x", leftMargin - 5)
.attr("y", barHeight / 2)
.attr("width", leftMargin)
.attr("dy", ".35em")
.style("fill", "black")
.style("text-anchor", "end")
.text(function(d) { return d.category; });
// Create the x-axis and append it to the bottom of the chart
var xAxis = d3.axisBottom().scale(x);
chart.append("g")
.attr("class", "x axis")
.attr("transform", "translate(0," + (barHeight * data.length) + ")")
.attr("x", leftMargin)
.call(xAxis);
}
CSS
We also have a couple of updates to our CSS this time. Here is what I have in my widget's CSS:
.chart rect {
fill: steelblue;
}
.chart text {
font: 10px sans-serif;
}
.centered-chart {
text-align: center;
}
.axis text {
font: 10px sans-serif;
}
.axis path,
.axis line {
fill: none;
stroke: #000;
shape-rendering: crispEdges;
}
Trying it out
Now that we have everything in place we will go ahead and test our updated widget out. The first thing we'll do is view our page in the page designer and hover over our widget. You should see a pencil icon in the top right corner of your widget. If you click that pencil you will get a modal that has your options in it.
Here is a screenshot of how I configured my widget instance:
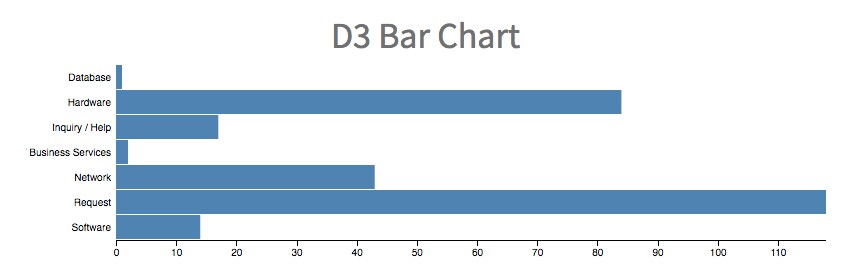
Here is what those options give me in action:
Next time
In the next post, we will explore how to use multiple datasets with D3 and how to make our chart interactive.
Mitch Stutler
VividCharts Founder
linkedin.com/in/mitchellstutler
Sources
Labels:
- 3,898 Views
3 Comments
You must be a registered user to add a comment. If you've already registered, sign in. Otherwise, register and sign in.

