


mitchellstutler
Tera Contributor
Options
- Subscribe to RSS Feed
- Mark as New
- Mark as Read
- Bookmark
- Subscribe
- Printer Friendly Page
- Report Inappropriate Content
09-21-2016
07:54 AM
In this post, we're going to create a Service Portal Widget that uses D3.js to create a basic bar chart. My hope is that by the end of this you will have a basic understanding of how to create a custom widget in the Service Portal as well as how to use D3.js. This will be the first of a series of similar posts that will build on each other.
D3js
D3.js stands for Data-Driven Documents and is a JavaScript library that was created to help build dynamic data visuals. Going forward, you might see me refer to D3.js as D3 or d3js.
There is a good chance that you have seen D3 in action without knowing it. People use it to create a wide array of interactive graphics on the web such as maps that have tooltips display when hovering over a certain region. If you want to see for yourself, check out some of the examples on the D3 website: https://d3js.org/.
I will try to outline the key pieces of D3 that we use in our widget, but for a deeper understanding of D3 I recommend checking out some of the tutorials that can be found on the D3 website.
Service Portal Widget
To display our bar chart in our Service Portal, we will create a custom widget. For this particular post, there will be 4 key parts to our widget: a Dependency, HTML, CSS, and Client Script. In future posts, we will leverage Server Scripts to dynamically pull data from our ServiceNow instance, but in this example we will just use some hard-coded demo data.
First, navigate to Widgets under the Service Portal application menu. Once we are viewing a list of existing widgets, click "New". Go ahead and give this widget a name and save the record. For my widget, I named it "D3 Bar Chart".
Dependency
In Service Portal, you can create Dependencies and then apply these Dependencies to multiple widgets. These Dependencies are collections or JS Includes and CSS Includes. For our widget, we will be creating a Dependency that will include the minified version of D3.
While viewing your newly created widget, scroll down to the related lists and you should see "Dependencies". Click "New" and give the new Dependency a name; I named mine "d3js". In the related lists section of your new Dependency, you should see "JS Includes". Click "New" and set the "Source" field to URL. In the "JS file URL" field give a value of "https://d3js.org/d3.v4.min.js" and submit the record.
Below is what my Dependency looked like when I finished. If yours looks similar, we are ready to head back to the widget.
HTML
Back in our widget, we can either edit from the normal view or the Widget Editor. I prefer the Widget Editor which you can get to by scrolling down to the related links section and click "Open in Widget Editor".
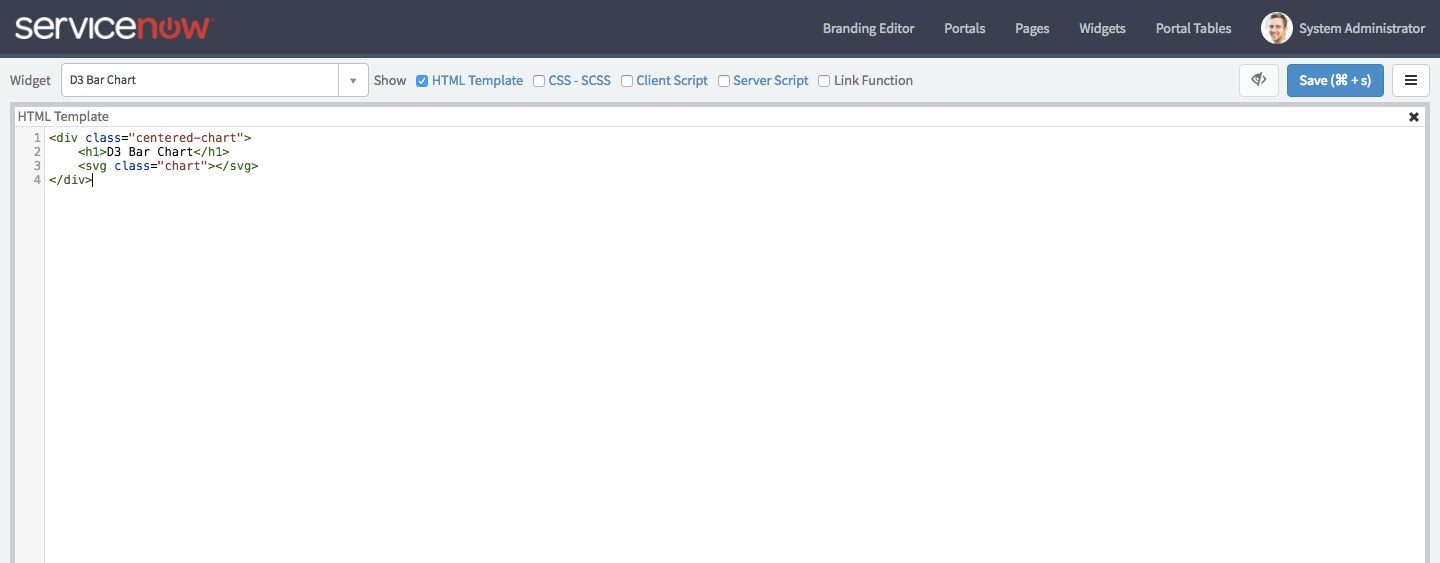
In the HTML field of our widget, paste the following code:
<div class="centered-chart">
<h1>D3 Bar Chart</h1>
<svg class="chart"></svg>
</div>
Later, our client script will use D3 to modify the SVG and display our bar chart. Below is a screenshot of the HTML of my widget:
CSS
In the CSS — SCSS field of our widget, past the following CSS:
.chart rect {
fill: steelblue;
}
.chart text {
fill: white;
font: 10px sans-serif;
text-anchor: end;
}
.centered-chart {
text-align: center;
}
These are the styles that will be applied to our bar chart. Below is what our widget definition should look like now that we have the HTML and CSS:
Client Script
We'll walk through each step of the client script and then I will provide the full script afterwards. All of this code should fall within the preexisting widget controller provided when first creating your widget.
First, we will define a hard-coded array of objects containing categories and values for each of these. As mentioned earlier, we will learn how to dynamically grab data in a later post.
var data = [{"category": "Hardware", "value": 10}, {"category": "Software", "value": 24}, {"category": "Inquiry", "value": 14}, {"category": "Network", "value": 34}];
Next, we will set the width of our chart along with the height of each bar within our chart.
var width = 600, barHeight = 20;
Now that we have the width and barHeight variables defined, we will use D3 to create a chart object and set these properties.
var chart = d3.select(".chart")
.attr("width", width)
.attr("height", barHeight * data.length);
The next piece is to create a function that will allow us to correctly scale each bar according to its value.
var x = d3.scaleLinear()
.range([0, width])
.domain([0, d3.max(data, function(d) { return d.value; })]);
After that, we are going to create an empty "g" container for each element in our data array. In the process, we will also be creating an object that we will reuse named "bar".
var bar = chart.selectAll("g")
.data(data)
.enter().append("g")
.attr("transform", function(d, i) { return "translate(0," + i * barHeight + ")"; });
Using the "bar" object that we created in the previous step, we are going to add a "rect" element to each of the rows.
bar.append("rect")
.attr("width", function(d) { return x(d.value); })
.attr("height", barHeight - 1);
All that's left now is adding a couple of "text" elements to each row to act as labels.
bar.append("text")
.attr("x", 3)
.attr("y", barHeight / 2)
.attr("dy", ".35em")
.text(function(d) { return d.category; });
bar.append("text")
.attr("x", function(d) { return x(d.value) - 15; })
.attr("y", barHeight / 2)
.attr("dy", ".35em")
.text(function(d) { return d.value; });
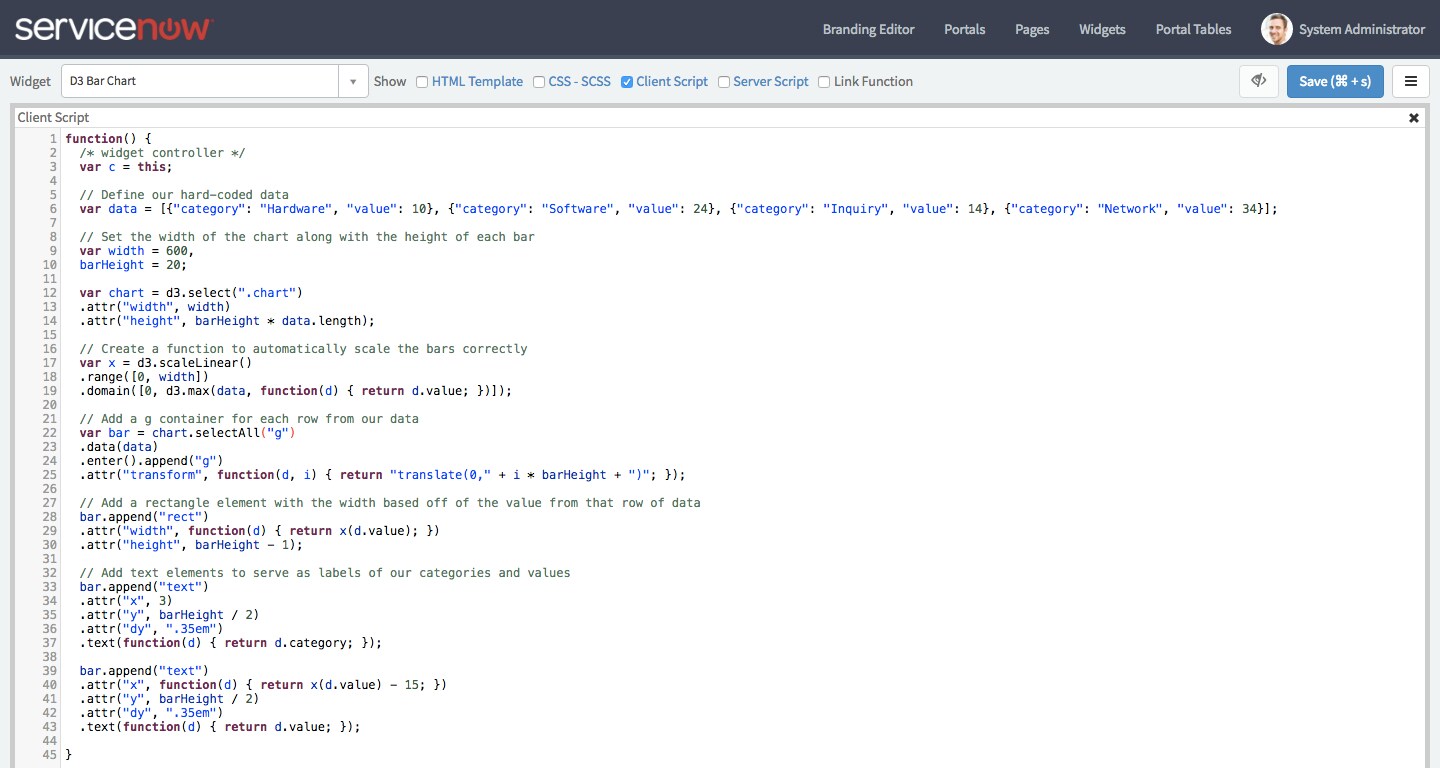
Below is the full script along with a screenshot:
function() {
/* widget controller */
var c = this;
// Define our hard-coded data
var data = [{"category": "Hardware", "value": 10}, {"category": "Software", "value": 24}, {"category": "Inquiry", "value": 14}, {"category": "Network", "value": 34}];
// Set the width of the chart along with the height of each bar
var width = 600,
barHeight = 20;
var chart = d3.select(".chart")
.attr("width", width)
.attr("height", barHeight * data.length);
// Create a function to automatically scale the bars correctly
var x = d3.scaleLinear()
.range([0, width])
.domain([0, d3.max(data, function(d) { return d.value; })]);
// Add a g container for each row from our data
var bar = chart.selectAll("g")
.data(data)
.enter().append("g")
.attr("transform", function(d, i) { return "translate(0," + i * barHeight + ")"; });
// Add a rectangle element with the width based off of the value from that row of data
bar.append("rect")
.attr("width", function(d) { return x(d.value); })
.attr("height", barHeight - 1);
// Add text elements to serve as labels of our categories and values
bar.append("text")
.attr("x", 3)
.attr("y", barHeight / 2)
.attr("dy", ".35em")
.text(function(d) { return d.category; });
bar.append("text")
.attr("x", function(d) { return x(d.value) - 15; })
.attr("y", barHeight / 2)
.attr("dy", ".35em")
.text(function(d) { return d.value; });
}
Add widget to page
All that's left is adding our new widget to a Service Portal page. I simply added mine to the bottom of the index page. Here is a screenshot of my finished widget being displayed in the Service Portal:
Next time
In the next post, we will build upon this bar chart to dynamically pull data using our widget's Server Script. We will also explore how to set up widget instance options.
Mitch Stutler
VividCharts Founder
linkedin.com/in/mitchellstutler
Sources
Labels:
- 8,062 Views
4 Comments
You must be a registered user to add a comment. If you've already registered, sign in. Otherwise, register and sign in.

