


tstammann

ServiceNow Employee
Options
- Subscribe to RSS Feed
- Mark as New
- Mark as Read
- Bookmark
- Subscribe
- Printer Friendly Page
- Report Inappropriate Content
06-28-2016
08:26 PM
Over the years that I have been at ServiceNow customers have often asked me how to determine the current health state of their CMDB. They want to know if CI's of a particular class (such as cmdb_ci_server) are populated with the correct attributes. They have expressed a desire to know if CI's meet a certain configuration standard so that CI's meet compliance rules. Another question that has come up in the past is "How do I know what CI's are out of date or stale?"
With the Helsinki release a new CMDB dashboard was released to address these types of questions. The new CMDB dashboard provides an overall health score which is derived from three major metrics - correctness, compliance and completeness, each further consisting of sub-metrics. Each metric is associated with a scorecard that determines the contribution of the metric to the aggregated health at the overall CMDB level, class, and CI level.
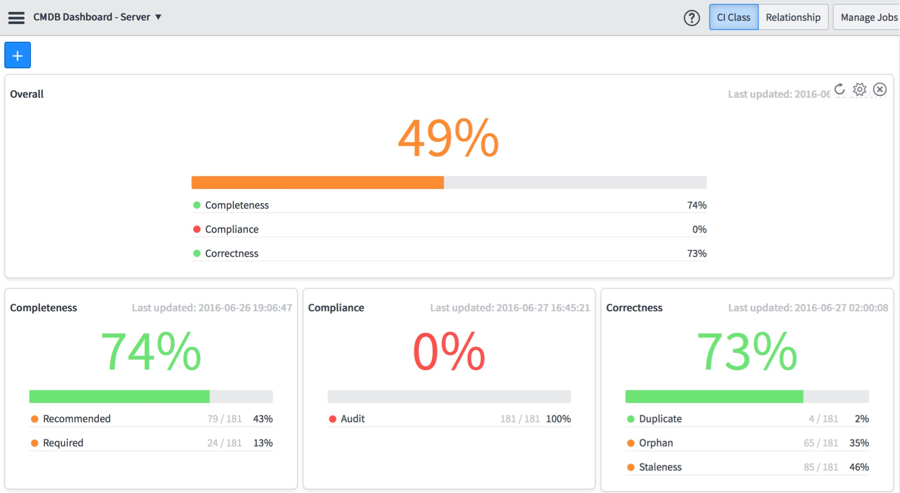
In the dashboard below we see the Overall health score for the entire CMDB. The Overall score is determined by a weighted average of the 3 C's — Completeness, Compliance & Correctness. When we look at each of the 3 C's we see a score that indicates how close each metric is to achieving 100%. Conversely, when viewing each sub-metric this is read as what percentage value the sub-metric is from achieving 100%. So for Completeness we are only 1% from populating all of our Recommended and Required fields; whereas, for Compliance we are in the 'red' in that we are 99% from being compliant.
To derive the most business value from this dashboard it should not be constrained to showing the overall score for only the entire CMDB, thus we have provided the ability to dive into any CI class so that customers can focus on the criteria that determine health at each CI class level .
Here we see the same dashboard focused on cmdb_ci_server. So we can very quickly understand that while we are 98% Complete from an overall CMDB standpoint, we have some work to do to close the gap for CI's in our Server class as we are only 74% Complete.
So what are the three major metrics that determine Overall health score?
Completeness
Completeness is a measurement that aggregates two sub-metrics that determine how well a CMDB is populated.
Required
- Required fields are mandatory. This measurement calculates the percentage of CI's that are not populated. Missing fields are tagged as incomplete indicating that information is missing for a particular CI.
Recommended
- Recommend fields are self-explanatory — they are recommended, but not required. Again, this is a measurement of the percentage of CI's that are not populated.
Compliance
Compliance enables administrators to certify CMDB data for correctness and fix any discrepancies found in the data. This is accomplished by defining Audit rules.
Audit
- The Audit metric compares actual values of specified fields, against expected values defined in a template or in a script. There are several different types of audits within the audit module — Desired State, Architectural Compliance and Scripted Audits. The CMDB dashboard uses the Desired State audit capability. Defining audits is a two-step process.
- Define the audit frequency and associate an audit template with the audit frequency.
- Define an audit template which determines the specified fields to compare.
- NOTE: The Desired State plug is activated by default.
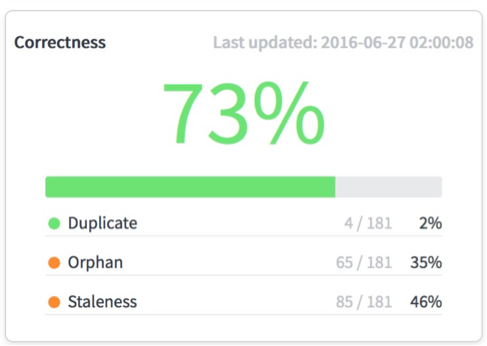
Correctness
Correctness is derived from the aggregation of three sub-metrics.
Duplicate
Measures the percentage of duplicate CI's in the CMDB using identification rules. Only independent CI's are evaluated for duplication. In a set of duplicate CI's, the count of duplicate CI's is the total number of CI's in the set, minus one. The detailed graphs for a duplicate set of CIs display all the CIs in the set.
Orphan
A CI can become an orphan if it was unintentionally left in the CMDB when it is no longer needed. A CI is determined to be orphan if:
- The CI matches the criteria in an orphan rule.
- The CI doesn't have any relationship in the relationship table.
- Data is missing for the CI in its respective table, or in one of its parents' tables.
To help make this a little more concrete here are a couple of examples:
- You have a number of MySQL DB instances that do not have an owner and have not been used in 60 days.
- You have VM's with no owners.
Staleness
A CI's staleness is determined using reconciliation and staleness rules for the CI's class, if it exists. Otherwise, there is a system staleness property that is used. A CI is determined to be stale if:
- The CI was not updated by the data source that was the last to update the CI, within the time frame defined in the staleness rule for the class for that specific data source.
- The CI wasn't updated for the length of time specified by the CMDB health system property glide.cmdb.health.staleness.
In addition, a relationship in which a stale CI is a parent or a child, is determined to be a stale relationship.
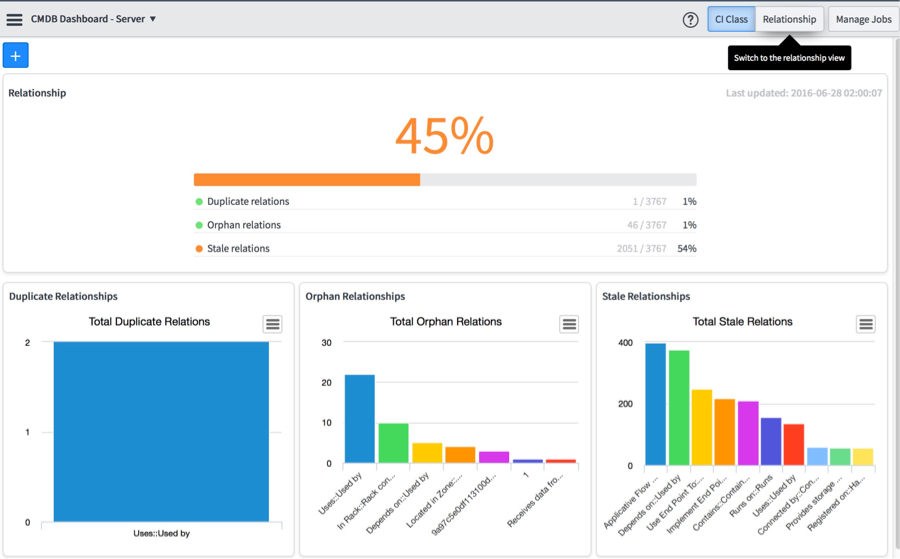
Thus far we have looked at the dashboard for CI's, but what about the relationships between CI's? We need a way to visualize the health of how our CI's are related to each other. Fortunately, the ability to view the health of relationships is only a click away at the top right of our dashboard as illustrated below.
Again we have an overall score that is derived from three metrics - Duplicate, Orphan and Stale relationships.
Duplicate
Duplicate relationships are defined as 2 relationship records that have the same parent and child.
Orphan
An Orphan relationship is one where either the parent or the child is missing.
Stale
A relationship is considered to be stale if the parent and/or child is considered to be stale.
In this blog post we introduced how the Helsinki release has made major steps forward in providing visibility into overall CMDB health as well as providing the ability to drill into any CMDB class and get a more granular look at the attributes for CI's within a particular class. We also introduced a dashboard to visualize the relationships between the CI's within the CMDB so that we now have a complete picture of overall CMDB health.
In our next installment we will dive into how to configure the metrics that determine the health scores as well as look at scheduled jobs that are run to apply the metric rules to the CMDB to produce the CMDB Dashboard scores.
For more information check out the following video based blog on the CMDB Dashboard - New in Helsinki: CMDB Health Dashboard
Labels:
- 27,549 Views
13 Comments
- « Previous
-
- 1
- 2
- Next »
You must be a registered user to add a comment. If you've already registered, sign in. Otherwise, register and sign in.

