


Vinh Tran1

ServiceNow Employee
Options
- Subscribe to RSS Feed
- Mark as New
- Mark as Read
- Bookmark
- Subscribe
- Printer Friendly Page
- Report Inappropriate Content
09-22-2018
07:21 AM
A few months ago, I had an opportunity to work with a ServiceNow customer on integrating their Datadog solution with Event Management using one of the update set developed by Datadog. It took some time to get everything working due to the following challenges:
- Locating the update set
- Clarity of the documentation regarding how to configure and set up the integration
- A bunch of links pointing to different web pages
- The solution not working as it is thus requiring modification, etc.
This week, one of my colleagues asked me to help him with the integration and ran into the same challenges I described above. Luckily, I documented what I learned and was able to help him resolve the issues in a couple hours.
I was speaking with Brian Walter, who just published a blog on “integrating New Relic and Event Management the Easy Way” https://community.servicenow.com/community?id=community_blog&sys_id=9224f523dbe06bc08e7c2926ca96199f and I agree with him that REST APIs and Webhooks is a more ideal methods for integration. On some down time today, I decided to see if I could figure out how to integrate Datadog with our Event Management using Webhooks.
I was challenged by this, and it took me a day to figure things out to get everything working. Because of this, I decided to help simplify the process in a few steps for you to get your integration going in a couple hours.
On your ServiceNow Instance
Step 1: Create an Event Management Integration User
Navigate to User Administration -> Users -> New, fill in the form with:
- Userid = datadog (or whatever name you want to use)
- Password = password
- Save
- Edit Roles and add the “evt_mgmt_integration” role
- Update
Step 2: Create Event Field Mapping Rule
Navigate to Event Management -> Rules -> Event Field Mapping -> New, fill in the form with:
- Name = datadog severity mapping
- Source = Datadog2
(NOTE: Source needs to match the source field coming from datadog webhook integration (see below) or set specifically in an Event Rule that pre-processes before the field mapping rule runs)
- Mapping type = Single field
- From field = severity
- To field = severity
Event Mapping Pairs: (warn, warning = 4, success = 0, and error = 1)
Note: these are the severities I observed so far, you may need to adjust as necessary
On your Datadog Instance
Step 3: Configuring datadog webhook
Note: I am assuming you will be working with your customer who knows datadog. Follow these steps:
1. In your Datadog instance, Navigate to integration -> search for webhooks
2. Click on the webhooks tile
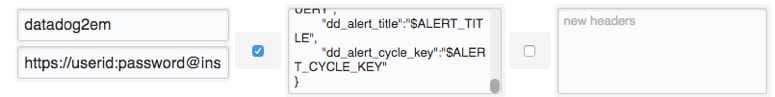
- Click on the configuration tab and fill in the form
- New name = datadog2em (this is the webhook name)
- New url = https://userid:pw@instancename.service-now.com/em_event.do?JSONv2&sysparm_action=insertMultiple
(userid and pw is the user you created in step 1)
- Select the “Use custom payload” check box
- Paste the below into the custom payload box.
(Note: The variable name on the payload is documented in the datadog website. I match what I think is the correct mapping.)
{
	"records": [{
	"source": "Datadog2",
	"node": "$HOSTNAME",
	"type": "$EVENT_TYPE",
	"event_type": "$EVENT_TITLE",
	"message_key": "$AGGREG_KEY",
	"metric_name": "$ALERT_METRIC",
	"description": "$TEXT_ONLY_MSG",
	"severity":"$ALERT_TYPE",
	"additional_info": "{'dd_id':'$ID',
	'dd_email':'$EMAIL',
	'dd_event_title':'$EVENT_TITLE',
	'dd_event_type':'$EVENT_TYPE',
	'dd_date':'$DATE',
	'dd_date_posix':'$DATE_POSIX',
	'dd_alert_id':'$ALERT_ID',
	'dd_alert_type':'$ALERT_TYPE',
	'dd_aggreg_key':'$AGGREG_KEY',
	'dd_org_id':'$ORG_ID',
	'dd_alert_stat':'$ALERT_STATUS',
	'dd_alert_scope':'$ALERT_SCOPE',
	'dd_hostname':'$HOSTNAME',
	'dd_user':'$USER',
	'dd_username':'$USERNAME',
	'dd_snapshot':'$SNAPSHOT',
	'dd_link':'$LINK',
	'dd_priority':'$PRIORITY',
	'dd_tag':'$TAGS',
	'dd_lastupdated':'$LAST_UPDATED',
	'dd_lastupdated_posix':'$LAST_UPDATED_POSIX',
	'dd_alert_metric':'$ALERT_METRIC',
	'dd_metric_namespace':'$METRIC_NAMESPACE',
	'dd_alert_transition':'$ALERT_TRANSITION',
	'dd_org_name':'$ORG_NAME',
	'dd_alert_query':'$ALERT_QUERY',
	'dd_alert_title':'$ALERT_TITLE',
	'dd_alert_cycle_key':'$ALERT_CYCLE_KEY'}"
	}]
}
- Click “Install Integration”
- Click on the “X” in the upper left to close that screen.
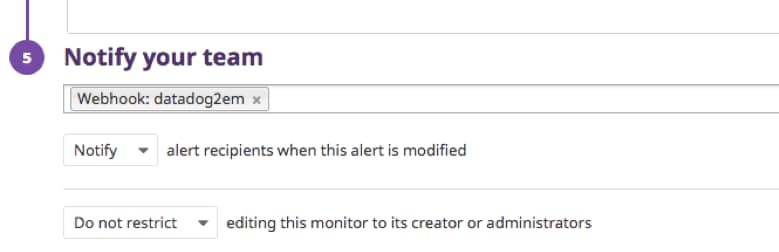
Step 4: Configuring datadog monitor to send notification
Note: I am assuming you will be working with your customer who knows datadog.
Your customer already has monitor set up all ready. They just have to add the webhook you created in step 3 to the notify your team as screen show below.
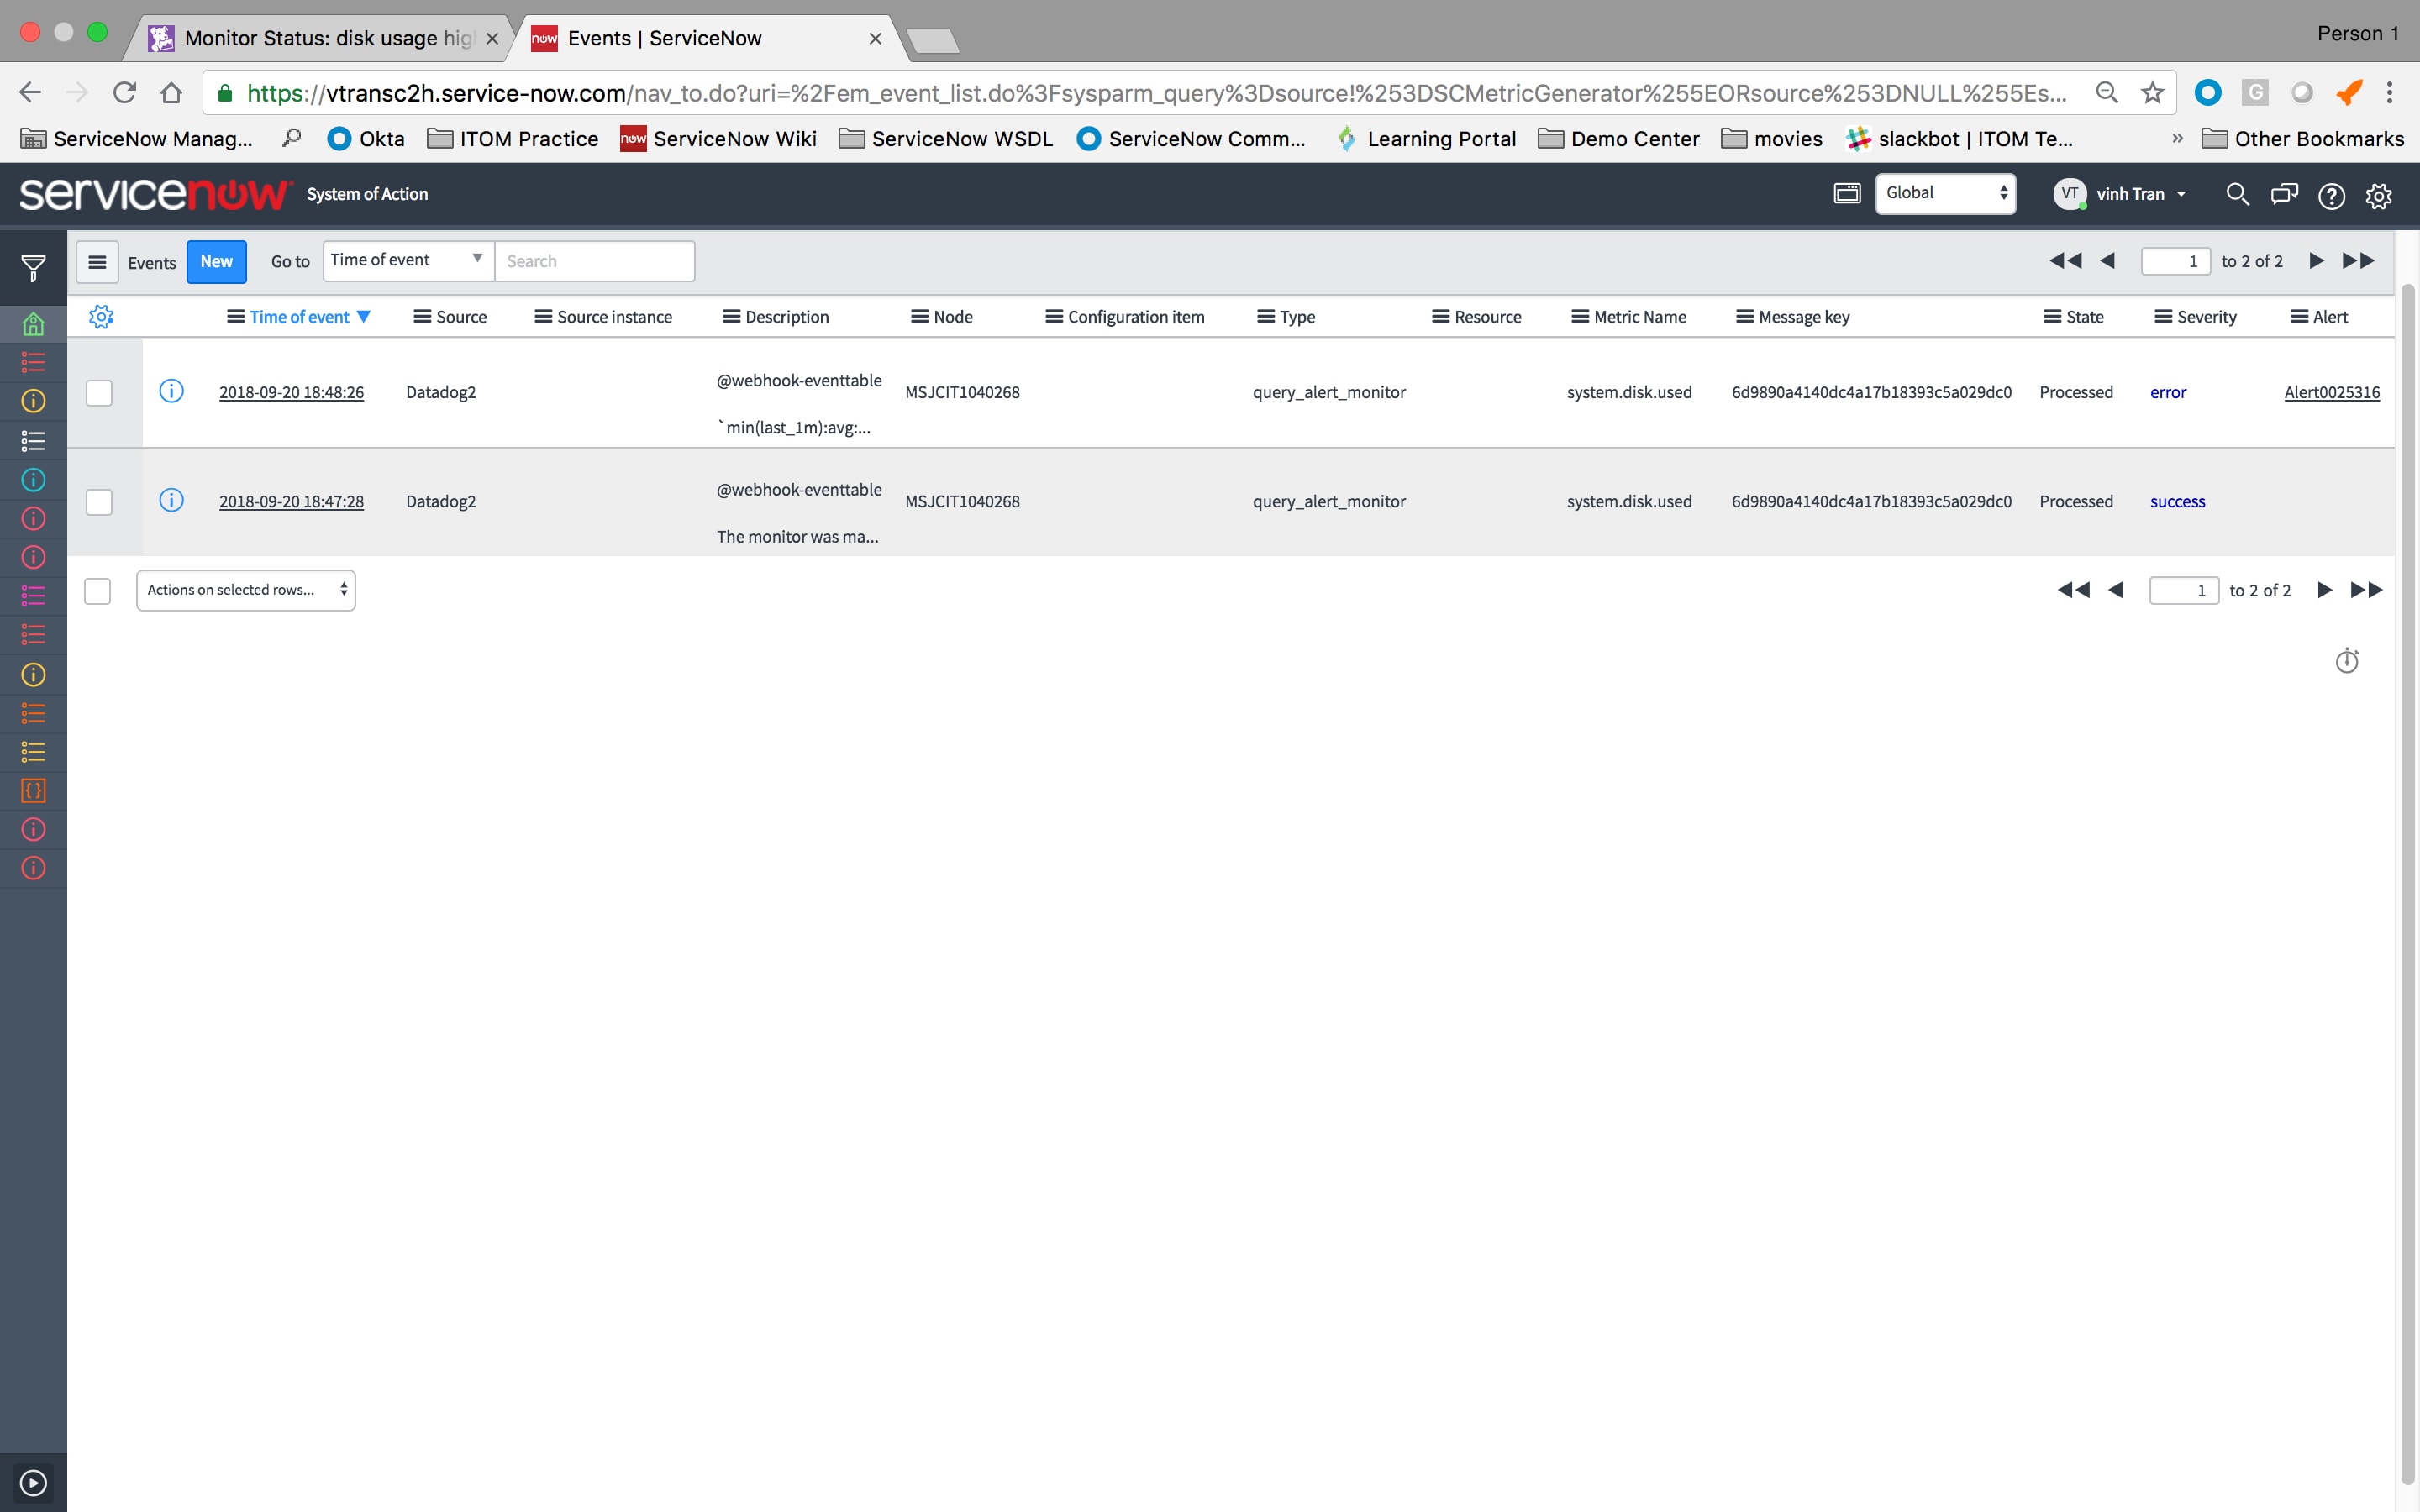
Check Result On your ServiceNow Instance
- Navigate to Event Management -> All Events and see the result as show
Note: We created the event field mapping rule for success = clear (so no alert was created) and error = critical (so alert was created)
- Drill into one of the events and you see the mapping to the event fields and all the key pairs value in the additional_info field.
- Now, Drill into the event with the alert and see how event from datadog map to the alert table. Notice the additional has a lot of data that mapped to the field prefix with dd_xxx from the payload in the webhook. These information can be useful when building event rule.
This concludes my blog and I hope you found it helpful to reduce your time in setting up the integration. Please feel free to reach out if you have any questions.
Labels:
- 12,607 Views
4 Comments
You must be a registered user to add a comment. If you've already registered, sign in. Otherwise, register and sign in.

