 The next release includes a spiffy new report that serves several purposes — watching the progress of a discovery, troubleshooting any problems, and analyzing discovery performance. It's called the Probe Report, because it shows you every probe that occurs in a given discovery. For each of these probes, the report contains useful information about the probe's progress, its performance, and (if the probe is complete) its success or failure. The Probe Report completely replaces two other reports: the Probe/Sensor mismatch report and the Probe/Sensor times report.
 You get to the Probe Report from the Discovery Status screen (see image at left — I've highlighted the link in orange). Anytime you want to see the report, just click on that link. If you click on it while a discovery is in progress, you'll see the current situation — the report is generated on-the-fly, so it's always got the most current information.
The report is actually just a table, and it behaves just like any other table in our product. That is, you can sort by any column, show only rows with a column matching a given value, etc.
 At right you can see an example of the report, in list form. This report happens to be for a discovery that has completed, so naturally all the probes have completed. The Sensors column shows a count of the number of sensors processed for each probe — this will be 0 for probes discovery hasn't yet received a response on, and 1 for probes that it has. The Probe ECC Queue column has references to the actual probe record in the ECC Queue — handy if you need to see the nitty-gritty details for that probe. The Probe Name, Probe created, and IP Address columns are what they seem to be, and the CI column contains a clickable reference to the actual CI being explored. Finally, the Probe ms and Sensor ms columns tell you how many milliseconds of elapsed time it took to process the probe and sensor, respectively.
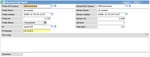
 If you drill into one of these Probe Report records, you'll see a form like the one at left. This has a few additional pieces of useful information. The Sensor ECC Queue field has a reference to the sensor's ECC queue record. The Total secs field shows the elapsed time between launching the probe and processing the sensor — useful for seeing how much processing backlog your instance has while handling discovery (just over two minutes, in this case). The Error msg field shows any error message reported by the sensor; it is normally blank.
 Finally, just for fun, here's a snapshot of a probe report taken while the discovery was in progress. Note that I've filtered out any rows with a "completed" status, so what I'm seeing here is just the stuff that's actually being worked on. You can see probes that have no sensor records — these are probes that are still being worked on by the MID server. The probes with a sensor record are those for which there is unprocessed data — meaning that the sensor has not yet run on them. There were a total of 47 active probes at the moment I took this snapshot. A few seconds later I refreshed the report (by clicking on the "bread crumb" visible at the top of the snapshot) and I saw 78 active probes. Each time I refreshed, I'd see something different — an ongoing, realtime image of Discovery's activities.
We think you'll like this new report, which incorporates several ideas y'all have share with us. If you've got any ideas how we could make it even better, please let us know!


