
dturchin
Tera Contributor
Options
- Subscribe to RSS Feed
- Mark as New
- Mark as Read
- Bookmark
- Subscribe
- Printer Friendly Page
- Report Inappropriate Content
06-17-2013
05:37 PM
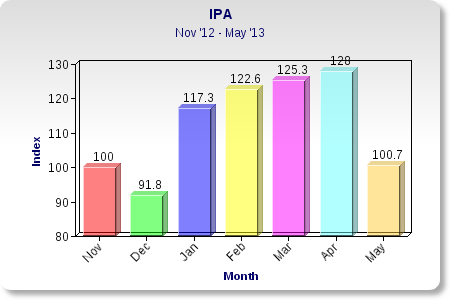
The Index of PaaS Activity (IPA) is our way of measuring the industry's progress toward app nirvana. 
It's not exactly a chicken in every pot but we think all organizations deserve a modern platform, a development environment designed for mere mortals, and apps users love. We think this PaaS phenomenon is creating a fundamental shift in how work gets done that will be every bit as influential as mobile, social, or big data.
We're chronicling the rise of PaaS by looking at key metrics each month that indicate where it's headed and how quickly it will get there. They include stock prices, job postings, tweets, headlines, and search traffic.
IPA went all 1999 on us in April then reversed course and did a 2001 in May. The index shed 21.3% during a period when the broad-based S&P 500 was up 2.1% and the tech-heavy NASDAQ was up 3.7%.
PaaS-related stock prices and job postings weigh heavily on the index and both were down during the period. PaaS headlines in tech pubs (+35.7%) and tweets (+13.9%) were up which kept the index from falling further. M&A activity, the public launch of RedHat OpenShift, and silly season for enterprise tech confabs all contributed to the glut of PaaS-related news.
1 Comment
You must be a registered user to add a comment. If you've already registered, sign in. Otherwise, register and sign in.

