


JF Muller

ServiceNow Employee
Options
- Subscribe to RSS Feed
- Mark as New
- Mark as Read
- Bookmark
- Subscribe
- Printer Friendly Page
- Report Inappropriate Content
04-30-2019
06:09 AM
The what and why…
In order to eliminate service outages, we must be able to predict potential anomaly before it turns into an actual outage. Proactively analyse your IT infrastructure performance to spot service degradation is the goal. Machine learning intelligence analyses operational metrics about IT infrastructure that might cause service outages, both on premises and in multi cloud environments. As an add on application to Event Management, Operational Intelligence is a key preventive ingredient to help eliminate service outages.
This module has the ability to integrate with any metric source, and a metric can be a measurable unit of just about anything. This module’s capability is to ingest metrics and by applying machine learning, automatically determines what a normal range would be for the specific metric by establishing the upper and lower bound.
However, it relies on a 3rd party to collects metric data from the source environment regularly.
ServiceNow Event Management and Operational Intelligence user interfaces are designed to handle a significant volume of events and metrics, which make them excellent candidates to complement a robust agent framework.
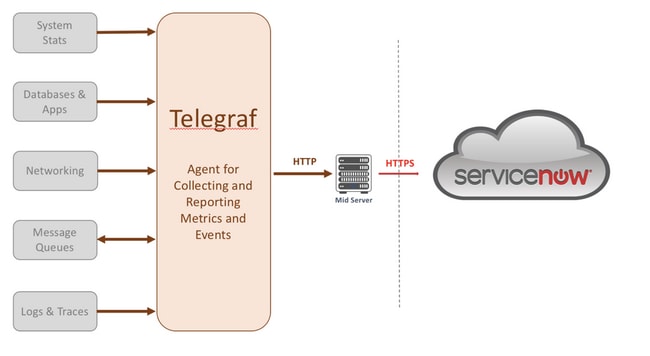
For this exercise, I have decided to use Telegraf, since it’s a modern opensource extensible agent framework (The first version of Telegraf was released in 2015) that has already a large community but no official integration with ServiceNow (so far).
Telegraf is an agent written in Go for collecting, processing, aggregating, and writing metrics.
The design goals of this his agent are to have a minimal memory footprint with a plugin system so that developers in the community can easily add support for collecting metrics
As of the writing of this blog entry, over 160 plugins developed by the community are available.
There are four types of plugins:
- Inputs: self-explanatory gather the Data
- Outputs: those are responsible for sending the data to your destination
- Aggregators: can perform things like means, media historically gram etc.
- Processors: do anything form adding tags to renaming fields.
Telegraf can grab metrics from host systems (CPU, I/O, Network etc) and also from 3rd party software like VMWare, Postgres, Redis and well as Cloudwatch.
Output plugins are able to send metrics to a variety of other datastores but was not so far able to send these metrics to ServiceNow.
The purpose of this blog is to illustrate how a modern open source monitoring agent can be used to complement ServiceNow and also contribute to the Telegraf community by providing a way to steam metrics to the ServiceNow Operational Intelligence module.
Therefore, alongside of this blog post, I have developed an interface that basically enable Telegraf agent to stream metrics to Operational Intelligence with a minimal configuration and I have submitted this development to the Telegraf community. This contribution has been accepted by the Telegraf community and included in their core code in Telegraf release 1.10.
This integration drafts a possible End-to-End Monitoring solution using a modern open source agent as collection layer and Service IT Operations Management suite for Intelligence and User Interface.
How?
The below research results and developments are based on ServiceNow London release although Kingston release does offer the same capabilities and of course this works with Madrid release as well.
My initial approach was to consider writing a specific output plugin, but after having researched the existing plugins I figured out that the HTTP output plugin does offer almost all what is needed.
It features the support of basic authentication credentials in HTTP post request which is a requirement from the MID Web Server Metric API.
It even features a JSON output format but unfortunately this format doesn’t match with the format expected by the MID server for Operational Intelligence metrics.
So, to make the metrics streaming possible, the only thing that was needed is an output format that complies with the ServiceNow OI specification.
Request payload specification example:
[{
    "metric_type": "Disk C: % Free Space",
    "resource": "C:\\",
    "node": "lnux100",
    "value": 50,
    "timestamp": 1473183012000,
    "ci2metric_id": {
        "node": "lnux100"
    },
    "source": “Telegraf”
}]
Telegraf offer the ability to customize the output formats via configuration, therefore the development of a custom serializer plugin that ensure to format the metric stream like expected by the MID metric API was required.
As already mentioned, this contribution has been integrated in the Telegraf core. (See v1.10 [2019-03-05] release note)
If you are looking to compile this extension with your own telegraf project, have a look for the files marked with “Add ServiceNow Metrics serializer” tags and import them in your repository: (This is not needed if you download the current release of Telegraf)
- plugins/serializers/nowmetric/nowmetric.go
- plugins/serializers/nowmetric/nowmetric_test.go
- plugins/serializers/nowmetric/README.md
- plugins/serializers/registry.go
From the ServiceNow side, you need to configure an Operational Intelligence MID Server. This link describe all steps needed to achieve this setup.
Please ensure to record the port number on which the MID API is going to listen to incoming requests/metrics. (MID Web Server Context form, HTTP/HTTPS Port)
Also ensure to use Basic Authentication Type when configuring MID Web Server extension and to store user name and the password so you can reuse them in the he agent configuration.
Once you have, an Operational Intelligence MID Server up & running, you can deploy and configure the Telegraf agent.
In my case, I have simply created a C:\Telegraf directory in which I have dowloaded the Telegraf binary and telegraf.conf configuration file (Attached to this blog post). This configuration file is designed for Windows.
To execute the agent with the above configuration, simply execute the following command:
> telegraf.exe –config telegraf.confIf you use Telegraf on another operating system, you will have to decide what you want to monitor. Running the following command will generate a sample config file listing many inputs and outputs. You can view the resulting telegraf.conf file if you wish.
> telegraf -sample-config -input-filter cpu:mem:swap -output-filter http > telegraf.conf
HTTP Output plugin has to be used and combination with the new serializer as describe in the configuration below.
The URL setting has to be setup to match your environment:
http://<MID SERVER IP OR FQDN>:<MID Web Server Extension Port>/api/mid/sa/metricsusername and password should match your MID Web Server Extension configuration.
The data_format parameter has to be set to “nowmetric" to ensure the new serializer is used.
Firewall setting should allow the communication between the host running the Telegraf agent and the MID Web Server extension and port.
Telegraf agent can be setup to send metrics locally or remotely to the mid server web server extension.
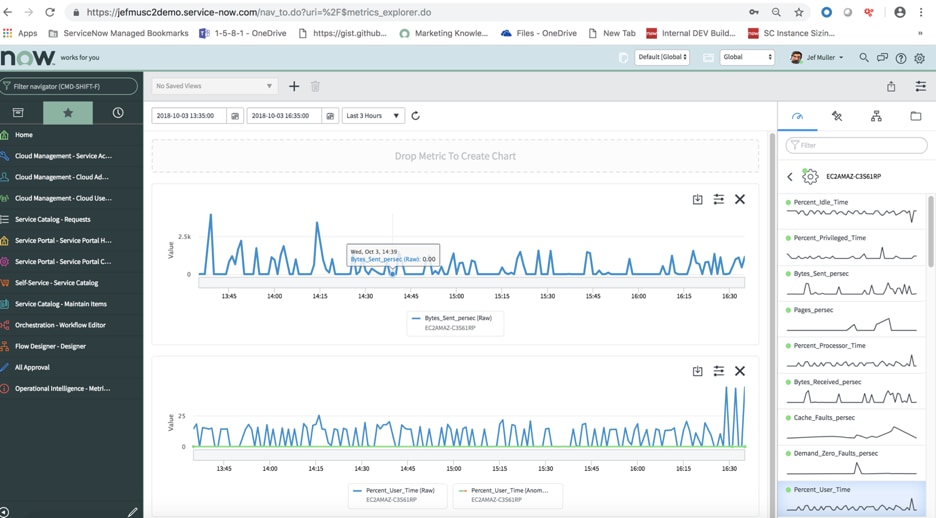
Operational Intelligence Metric Explorer can be used to visualize the metric collected:
The metric threshold does take a little while (at least a few hours) to generate because it requires time (a couple of hours at least). Once the threshold is generated, you should start seeing anomaly scores in the Anomaly map.
Hope you enjoyed the exercise. Feel free to provide us feedback. We might eventually develop this further if there is an interest from the community.
I'd like to thanks Daniel Nelson (Telegraf Community Manager) for his advice and code review.
Labels:
- 2,975 Views
2 Comments
You must be a registered user to add a comment. If you've already registered, sign in. Otherwise, register and sign in.

