- Post History
- Subscribe to RSS Feed
- Mark as New
- Mark as Read
- Bookmark
- Subscribe
- Printer Friendly Page
- Report Inappropriate Content
on 08-25-2021 09:09 AM
Key Performance Indicators (KPIs) drive process improvement and operational awareness for the current performance of a system. As it relates to the area of AIOps, KPIs come in many forms because of the broad range of capabilities an AIOps environment provides. Some of these may reflect how effective the noise reduction is (deduplication and correlation), others may reflects how many critical issues are currently unassigned, and yet others may show how long various parts of the process are taking to get completed.
There are out of the box (OOTB) dashboards in the IT Operations Health module which show many, many metrics and KPIs. However, KPIs related to common AIOps measures for how long it's on average taking to move from one part of the triage and resolve process to another is lacking.
Health Log Analytics Dashboard
I would urge anyone getting started to evaluate the doc pages above and look at the definitions of each metric provided OOTB.
In part 1 of this 2 part series, I am going to show a way to create additional "duration" metrics and be able to report on those metrics. In part 2, I will expand into the ability to do similar reporting at an application service level using OOTB SLA capabilities.
What I mean by "duration" metrics is being able to capture how long a record (an alert in this case) is in a current state. This may be useful in determining MTTX (mean time to [insert your metric here]), but we will specifically focus on one option for evaluating MTTD (mean time to detect). This in itself may be controversial as MTTD is going to be synonymous with MTTA (mean time to acknowledge), the latter being another common AIOps KPI. More on this just below.
There will be 3 components of the platform, not including alerts in the event management module, which will be used to deliver the KPI.
1. Metrics
The metrics generated from the process could be used in performance analytics to create trending data and other more sophisticated reports, but that is outside the scope of what I will cover in this article.
Let me start by explaining the approach which I will evaluate MTTD. This may be a simplistic approach for your organization, but will serve and an example nonetheless. The reality is that it is very process driven, which is what makes this overall approach of defining metrics great because you have the flexibility to adapt the system based on your process. Here we will use the "Acknowledged" value on an alert.
So why MTTD vs MTTA in this case? My personal opinion (not an official ServiceNow stance) is that MTTD, usually defined as how quickly an issue is identified, is initially only accepted when the "identification" comes from a human. Once a machine generates an alert that something has broken, you could systematically run some initial diagnostics, have the results process through predefined logic, and then automatically assigned, change the severity, or close as a false positive. The outcome of all that could drive "identification" or "detection" of an issue, but I rarely have seen that automation adopted in most AIOps environments, which is why I'm overlapping MTTD with MTTA. For me, MTTA represents a person or predefined process acknowledging the existence of an issue and beginning the triage. Sounds a lot like "identifying" there is an issue, doesn't it? Either way, it's just an example.

Acknowledged Field on an Alert
The Acknowledged value could be set manually as an operator begins to work on an alert, or it could be set programmatically in a flow that is initiated as part of trying to triage or remediate an alert. In either case, I want to use the time between when the event / alert is initially created and when it gets acknowledged. When an alert is acknowledged, there is no dedicated timestamp to denote that change.
Step 1: Metrics
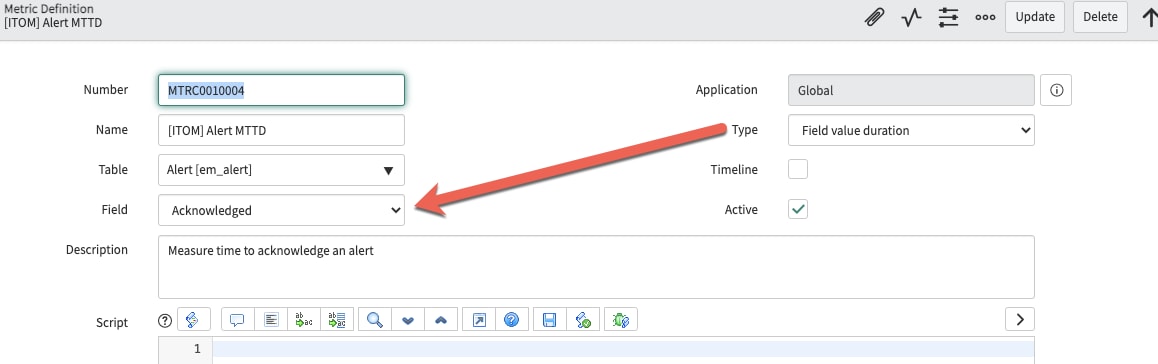
In comes our use of the platform's "Metrics" module. You'll have to ensure the plugin has been activated in your instance, but once it is, you navigate to Metrics -> Definitions and create a New entry. As the screenshot below shows, the most simple way to define a metric is to just set the "Type" to be "Field value duration" for a given table and field combination.

Metric Definition Example
In the example above, each time the "Acknowledged" field changes on an alert, a new metric instance record will be created and the duration it was set to the previous value will be calculated.
A caveat to creating metric definitions is that you will have to duplicate the default business rule which triggers metric creation because OOTB it only works on the task table (and child tables, which alert is not). If you look for a business rule named "metrics events" which should be associated with the task table, then you can simply change the table to "Alert" and then INSERT AND STAY (do NOT just save the change as you will cease to get metrics created on incidents and other task tables).

Duplicated Business Rule to trigger metrics for Alerts
In some of my initial testing, the "Field Value Duration" Type of metric on the Acknowledged field gave some undesirable results because it would calculate the initial duration before the alert was acknowledged (detected), but it would subsequently create metric records trying to track how long the acknowledged flag remains true. These latter records are not necessary in my use case because my MTTD just wants to measure how long before someone acknowledges an event for the first time.

Metrics with value "true" are not needed for my MTTD
To solve this problem, I had to go to the scripted calculation type of metric definition. This is just a matter of changing the "Type" field on the Metric Definition record above, and the paste in the following code.
var ack = current.acknowledged;
var state = current.state;
// Only create a metric instance when the acknowledged flag changes from false
// Other conditions like not creating these metric for secondary alerts (or only primary alerts), etc could be applied
if (ack == true && state == 'Open')
	createMetric();

function createMetric(){
	var mi = new MetricInstance(definition, current);
	if (mi.metricExists())
		return;

	var gr = mi.getNewRecord();
	gr.start = current.initial_event_time.getDisplayValue();
	var now = new GlideDateTime();
	gr.end = now.getDisplayValueInternal();
	gr.duration = gs.dateDiff(gr.start, gr.end);
	gr.calculation_complete = true;
	gr.value = false;
	gr.insert();
}
Code snippet for Metric Definition
In the above code snippet, the initial condition is evaluating that the Acknowledged field has changed to true and only creating a metric instance if so. This will avoid a metric instance from being created to evaluate how long it remains true.
Step 2: Database View
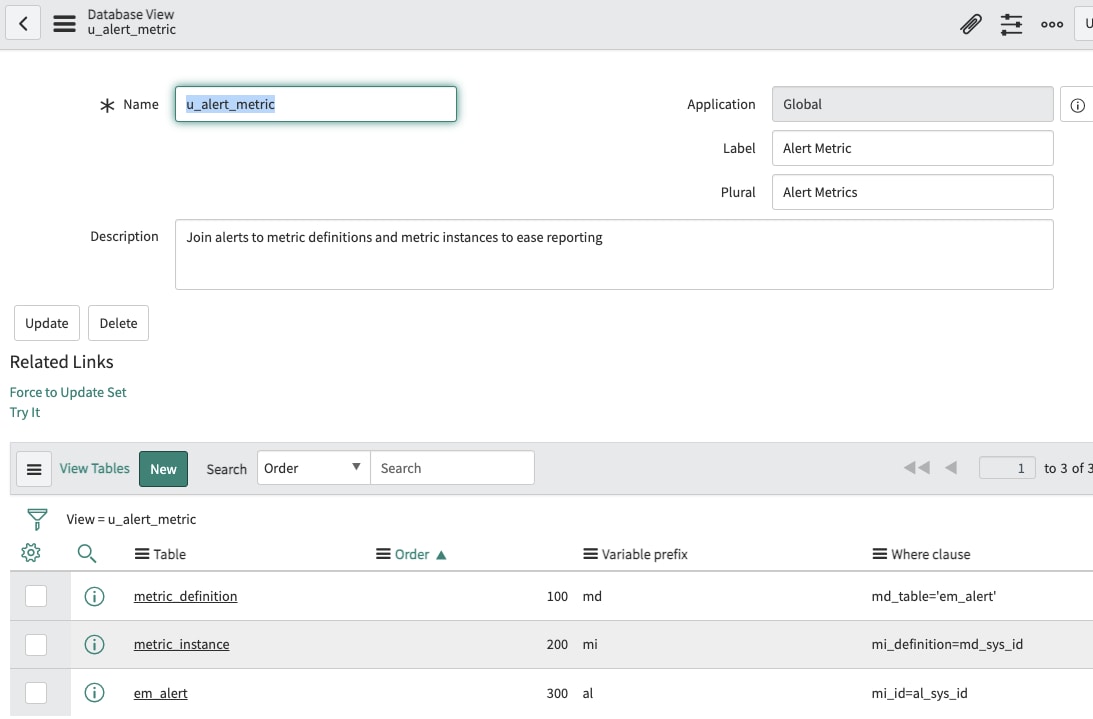
Now that we have the metrics being created as desired, let's see how we can use them. By themselves the metric instance records will give us limited fields to report upon, so the step of creating a database view becomes useful so we can create more robust reports. Let's create our database view which will combine the entities we have used so far (Metric Definition, Metric Instance, and Alert).

Database View for reporting on Alert metrics
Step 3: Reports and Dashboards
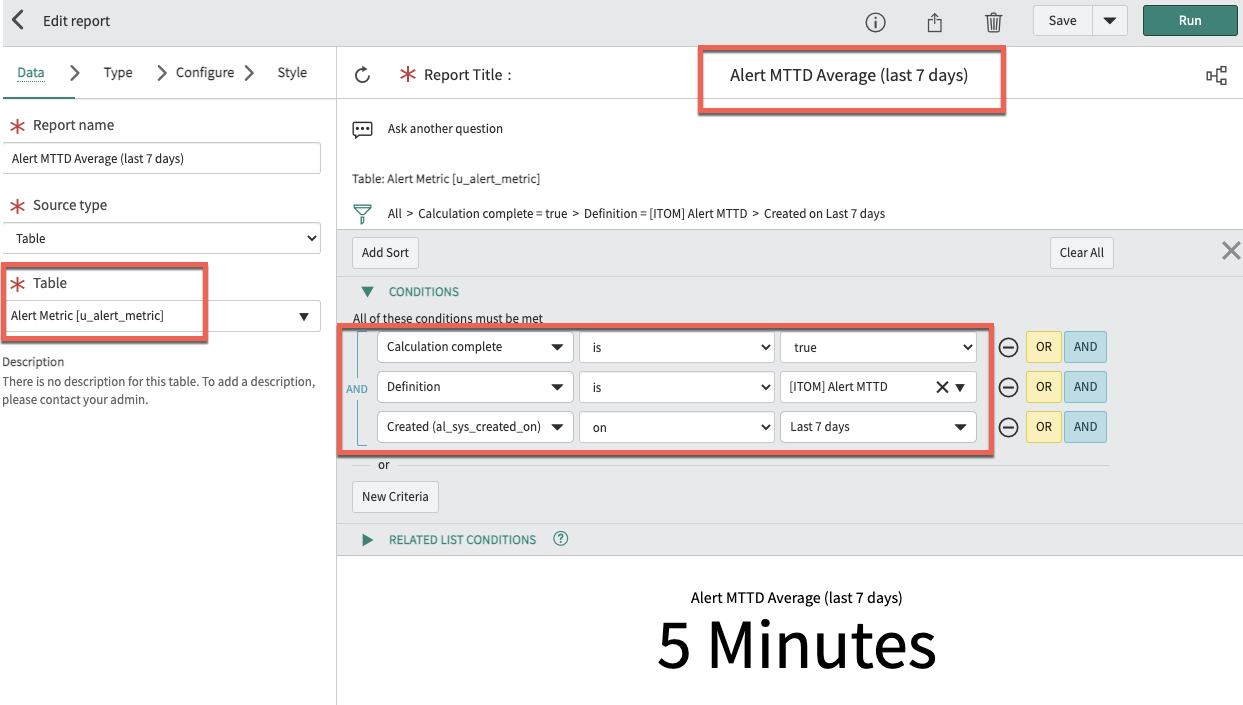
While I won't spend too much time covering the basic platform topic of creating reports and dashboards, I will show a high-level view of an example using the database view to give us the MTTD metric on a report which can then be added to a dashboard. Below is a report where we use the "Table" value as our database view defined in Step 2 above. You will notice that I have filtered the example to show only metrics that a fully calculated, and only pull in the Metric Definition we used in this example for MTTD, and finally just show the last 7 days worth of alerts and their MTTD.

Report for MTTD
On the report definition above, the "Configure" tab has specified the Aggregation type as "Average" and the value as "Duration". From the report definition, you may add the report to an existing dashboard for a consolidated view of all relevant metrics. Further usability can introduce interactive filters on the dashboards so that a user could filter by additional attributes like Assignment groups on alerts or sources, etc.
Summary
Hopefully this article has shown how various platform features can be used to enhance KPI tracking for your AIOps implementation within ServiceNow. While there are many great metrics and KPIs out of the box with out of the box dashboards, being able to define your own based on specific process behaviors will provide another level of flexibility for tracking what matters to your organization.
- 4,036 Views