- Post History
- Subscribe to RSS Feed
- Mark as New
- Mark as Read
- Bookmark
- Subscribe
- Printer Friendly Page
- Report Inappropriate Content
on 08-25-2021 02:44 PM
In Part 1 of this series, I described how to use platform features to capture time duration of record state with the outcome of creating duration-based KPIs like Mean Time to Detect (MTTD). The approach described in the first article requires a table and an attribute of that table to be specified (though filters and such may be coded). My example in the first article looked at measuring MTTD for alert records. While a useful starting point, my experience has been that customers want to measure MTTD, MTTR, etc at a service level. Measuring at the service level using out of the box (OOTB) service level agreement (SLA) capabilities will be the focus of this part of the AIOps KPI series.
A bonus discussion will also be included at the end on the topic of how to evaluate the value of ITOM and AIOps within an organization based on a potential method of evaluating how many outages have been avoided by implementing ITOM.
To begin, the basics of using the OOTB SLA module are covered in my colleague Jason's 2016 blog. The same constructs and principles apply, and really just the change from a legacy workflow to a new flow designer flow is all that is new. As such, I will not be repeating those basics. My goal is to provide additional configuration guidance on how to trigger different SLA / OLA types for reporting purposes to capture MTTD and Mean Time to Resolve (MTTR) metrics at an application service level.
Defining a SLA / OLA for MTTD
As noted in Jason's blog, the em_ci_severity_task table is the key driver of knowing what the state of an application service is at any given moment because a record is created in this table each time a new application service is created (and the SLA module is driven from task records, which an alert is not). Below is a SLA definition for MTTD for a single application service, which happens to be named "aMoneyMaker".

SLA Definition for MTTD
Let's take a close look at the 3 main components with the red box around them in the SLA definition above. First, the Type, Target, and Table values. Type and Target are primarily used just for reporting, which we will see later in this article. The Table value is our em_ci_severity_task table, which tracks the severity state of our application service based on alerts being created by the event management module and corresponding impact calculations.
Next, the Duration Type and Duration values are specified. These are the targets within which we want to have our SLA / OLA met. In our example above, I want the initial response to happen within 15 minutes of the SLA starting. While I will not cover using these targets, it is useful to note that they could be used to evaluate how many issues are meeting the SLA targets.
The final section highlighted in the above SLA definition is the start trigger / condition. This is where we need to specify our application service (unless you want this SLA to apply to ALL application services). In the example, the "CI is aMoneyMaker" clause will make this definition only apply to that particular service. Also in the filter is which severities will drive the condition to start. My example will only trigger when a service goes into a Critical or Major state. A final condition exists which checks the "Needs Attention" flag because this is the value the still drive our stop condition (see below).
So now we have started our SLA when alerts apply to the "aMoneyMaker" application service and impact the service in a Critical or Major way. Let's take a look at how we can measure the initial response time at the service level. In part 1 of this series I used the "Acknowledged" value of an alert to indicate a response / detection has been made and represents MTTD / MTTA. However, the em_ci_severity_task table does not have an "Acknowledged" attribute. The "Needs Attention" attribute is a suitable alternative as a person or process (e.g. an alert management subflow) would set the service level attribute to "true" for this attribute to represent it has been identified / detected.
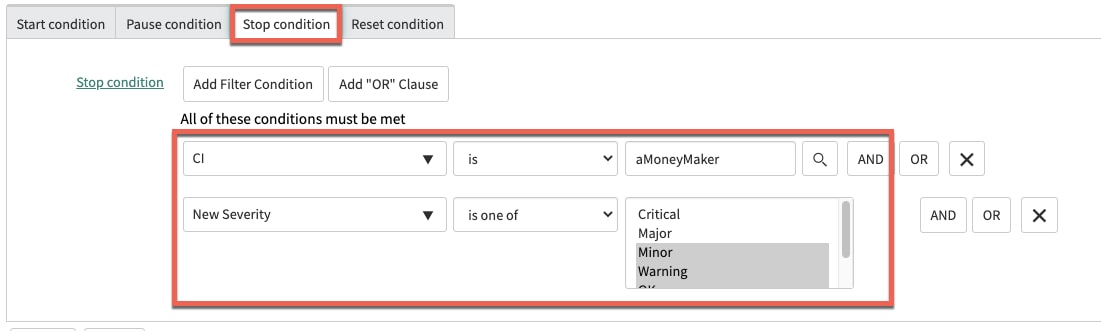
Now our "stop condition" for the SLA / OLA needs to be defined to account for this change in attribute value.

Stop Condition for MTTD SLA / OLA
When the em_ci_severity_task record enters this state (needs attention is true) our task_sla record will change to being in a "Completed" stage and we have our duration of time captured for how long it took to detect an issue with our service. The section on reporting below will explain how to use this record (and others) to derive MTTD for the service.
Defining a SLA / OLA for MTTR
Very similar to the SLA definition for MTTD, the MTTR definition below will trigger when a service enters a Critical or Major severity state. You will notice a few other differences from the MTTD definition as well in that this definition has a Target value of "Resolution" instead of "Response" and the duration is 45 minutes instead of 15 minutes.

SLA Definition for MTTR with Start Condition
The resolution concludes in this definition when the service severity drops below Major (i.e. it becomes just Minor, Warning, OK, or Clear).

MTTR Stop Condition
At this point, we now have task_sla records being created for our em_ci_severity_task record based on tracking when service level attributes (Needs Attention and New Severity) change for a particular service. In these 2 SLA definition examples I have defined the "CI" value as well so that it will only apply to a specific application service. This could be altered to include more CI's (using the OR condition) or the CI could be removed completely so that the definition would apply to all application services.
Reporting on Service Level MTTD and MTTR
As noted previously, when a SLA triggers it creates a task_sla record. These records represent the individual occurrence of a SLA measurement. These records will form the basis of our reporting. Below we see an em_ci_severity_task record and its associated task_sla records based on the definitions above.

task_sla Records Associated with an EM SLA Task Record
Creating the report becomes easy as we can use the aggregation feature to get the average of the "Business Elapsed Time" for a given SLA definition (below).

Report Definition for MTTD
The "Data" tab would show us using the task_sla table as the source for this report. Of course additional filters could be added to limit the timeframe evaluated or other factors of the table. One inconvenient fact is that the ability to filter to the CI on the em_ci_severity_task table (which we used in the filter for start and stop conditions) is not accessible in the filter as the report is defined above. A database view would have to be created to accommodate this shortcoming, which would give the ability to apply interactive filters so users could create a single report and use for all services based on applying a dashboard interactive filter.
For the sake of this article, the dashboard below shows the report widgets for MTTR and MTTD as defined in this article.

Dashboard for a Service's MTTR and MTTD
Measuring Value from Outage Avoidance
A common request from customers is to answer, "How do I measure how many outages my organization has avoided by using ServiceNow ITOM?". While a very relevant and important question, this can be a challenging question to answer given we are trying to measure something that did not happen.
My guidance on approaching the question is to evaluate all the components implemented and the processes defined. Ask questions like:
- Do you use IntegrationHub with alert management rules to automatically remediate issues as they come in?
- If yes, do you have those flows create incidents or outage records only if the remediation effort fails?
- If the remediation succeeds, how do you identify those flows (output values, incidents created with specific close codes, etc)?
- If no, how do you measure avoiding an outage?
To effectively and systematically answer this question on an ongoing basis, process must be automated within ServiceNow. Machine generated data (events / alerts) will most likely tell you that an outage is occurring (maybe it's a combination of many alerts that have to drive this designation, or a response time metric, 40X codes, etc). By associating the proper flows with alert management rules, an organization can automate a consistent record creation process to allow for the desired reporting.
Some quick hints to achieving this could be to create subflows for alerts which have a consistent output value set (remediation failed / succeeded, outage created / not created, etc) and then either score the sys_flow_context records with these various values (using performance analytics to keep long-term trends) or just report (if the organization does not own PA) on the records for point in time views. It's important to note that these records are not kept forever and are not likely part of the tables available to be reported upon by default in the report designer. You can see retention of these record types here.
What is Not Covered?
In part 1 and in this article we have discussed reporting on AIOps KPIs in various ways. What we have not covered are more advanced capabilities on reporting which can feed OOTB reporting in places like the service owner workspace. The data displayed in these very useful interfaces require an organization to define service commitments, service offerings, creating outages, etc. For more information on this workspace, please read the docs for how to best setup the necessary objects.
Conclusions
Throughout part 1 and this part 2 of creating AIOps KPIs we have seen that there are multiple ways of creating and reporting on KPIs like MTTD, MTTR, and others. Much of the difference comes from reporting on individual records like alerts, or reporting on higher level constructs like application services. The key to both is:
- understanding a consistent process which can be applied for consistent reporting, and
- understand the attributes on the relevant records which may be used to drive this consistency
As with most things in ServiceNow, there are many ways to solve a problem. Some are driven by modules an organization is entitled to, but most are driven by the ability to define and implement automated processes to create consistent record keeping. Whichever path is chosen, the main point is noting the flexibility available to define metrics that fit with the definitions your organization has for measuring improvement and performance of the AIOps implementation.
- 3,541 Views