- Post History
- Subscribe to RSS Feed
- Mark as New
- Mark as Read
- Bookmark
- Subscribe
- Printer Friendly Page
- Report Inappropriate Content
on 02-28-2022 01:21 PM
ServiceNow has a built-in ability to ingest alert notifications from LightStep. Here's an example of how to do it and in turn decrease MTTR by automatically correlating alerts from multiple sources.
Test Set-Up
My test platform consists of the following elements:
- a LightStep project to receive Open Telemetry
- a simple script written using Flask which instantiates a web service and sends Open Telemetry data into Lightstep
# flask_example.py
import flask
import platform
import requests
from opentelemetry import trace
from opentelemetry.instrumentation.flask import FlaskInstrumentor
from opentelemetry.instrumentation.requests import RequestsInstrumentor
from opentelemetry.sdk.trace import TracerProvider
from opentelemetry.sdk.resources import Resource
from opentelemetry.sdk.trace.export import (
BatchSpanProcessor,
ConsoleSpanExporter,
)
from opentelemetry.exporter.otlp.proto.grpc.trace_exporter import (
OTLPSpanExporter,
)
span_exporter = OTLPSpanExporter(
# optional
endpoint="<redacted>",
# credentials=ChannelCredentials(credentials),
# headers=(("metadata", "metadata")),
)
resource=Resource.create(attributes={
"service.name":"wh-test-service",
"service.version":"1.0.1",
"telemetry.sdk.language":"Python",
"host.name":platform.node(),
"host.id":platform.node(),
"host.arch":platform.processor(),
"host.type":platform.system()
})
trace.set_tracer_provider(TracerProvider(resource=resource))
trace.get_tracer_provider().add_span_processor(
BatchSpanProcessor(span_exporter)
)
#trace.get_tracer_provider().add_span_processor(
# BatchSpanProcessor(ConsoleSpanExporter())
#)
app = flask.Flask(__name__)
FlaskInstrumentor().instrument_app(app)
RequestsInstrumentor().instrument()
tracer = trace.get_tracer(__name__)
@app.route("/")
def hello():
with tracer.start_as_current_span("example-request"):
requests.get("http://www.example.com")
# requests.get("http://localhost")
return "hello"
@app.route("/error")
def ohno():
with tracer.start_as_current_span("example-request"):
requests.get("http://localhost")
return "oh no"
app.run(debug=True, port=5000)- a tag-based Application Service, "wh-test-service", in my ServiceNow CMDB, which consists of Azure functions and Kubernetes pods (e.g. https://docs.servicenow.com/bundle/rome-it-operations-management/page/product/service-mapping/task/map-service-tag.html)
- test events which will trigger alerts in ServiceNow against the Azure function and Kubernetes components


- a test script which will generate valid and erroneous transactions within the Flask application
#!/bin/bash
while [ 1 = 1 ]; do echo `curl -s http://localhost:5000`;echo `curl -s http://localhost:5000`;echo `curl -s http://localhost:5000/error`;echo `curl -s http://localhost:5000`; sleep 1; done
With these components assembled, I followed the instructions here to enable event collection from my LightStep project: https://docs.servicenow.com/bundle/rome-it-operations-management/page/product/event-management/task/lightstep-event-collection.html
Testing The Configuration
Once the setup was completed, I ran the following test scenario:
- In ServiceNow, open the Operator Workspace; observe the service "wh-test-service" is in a green state

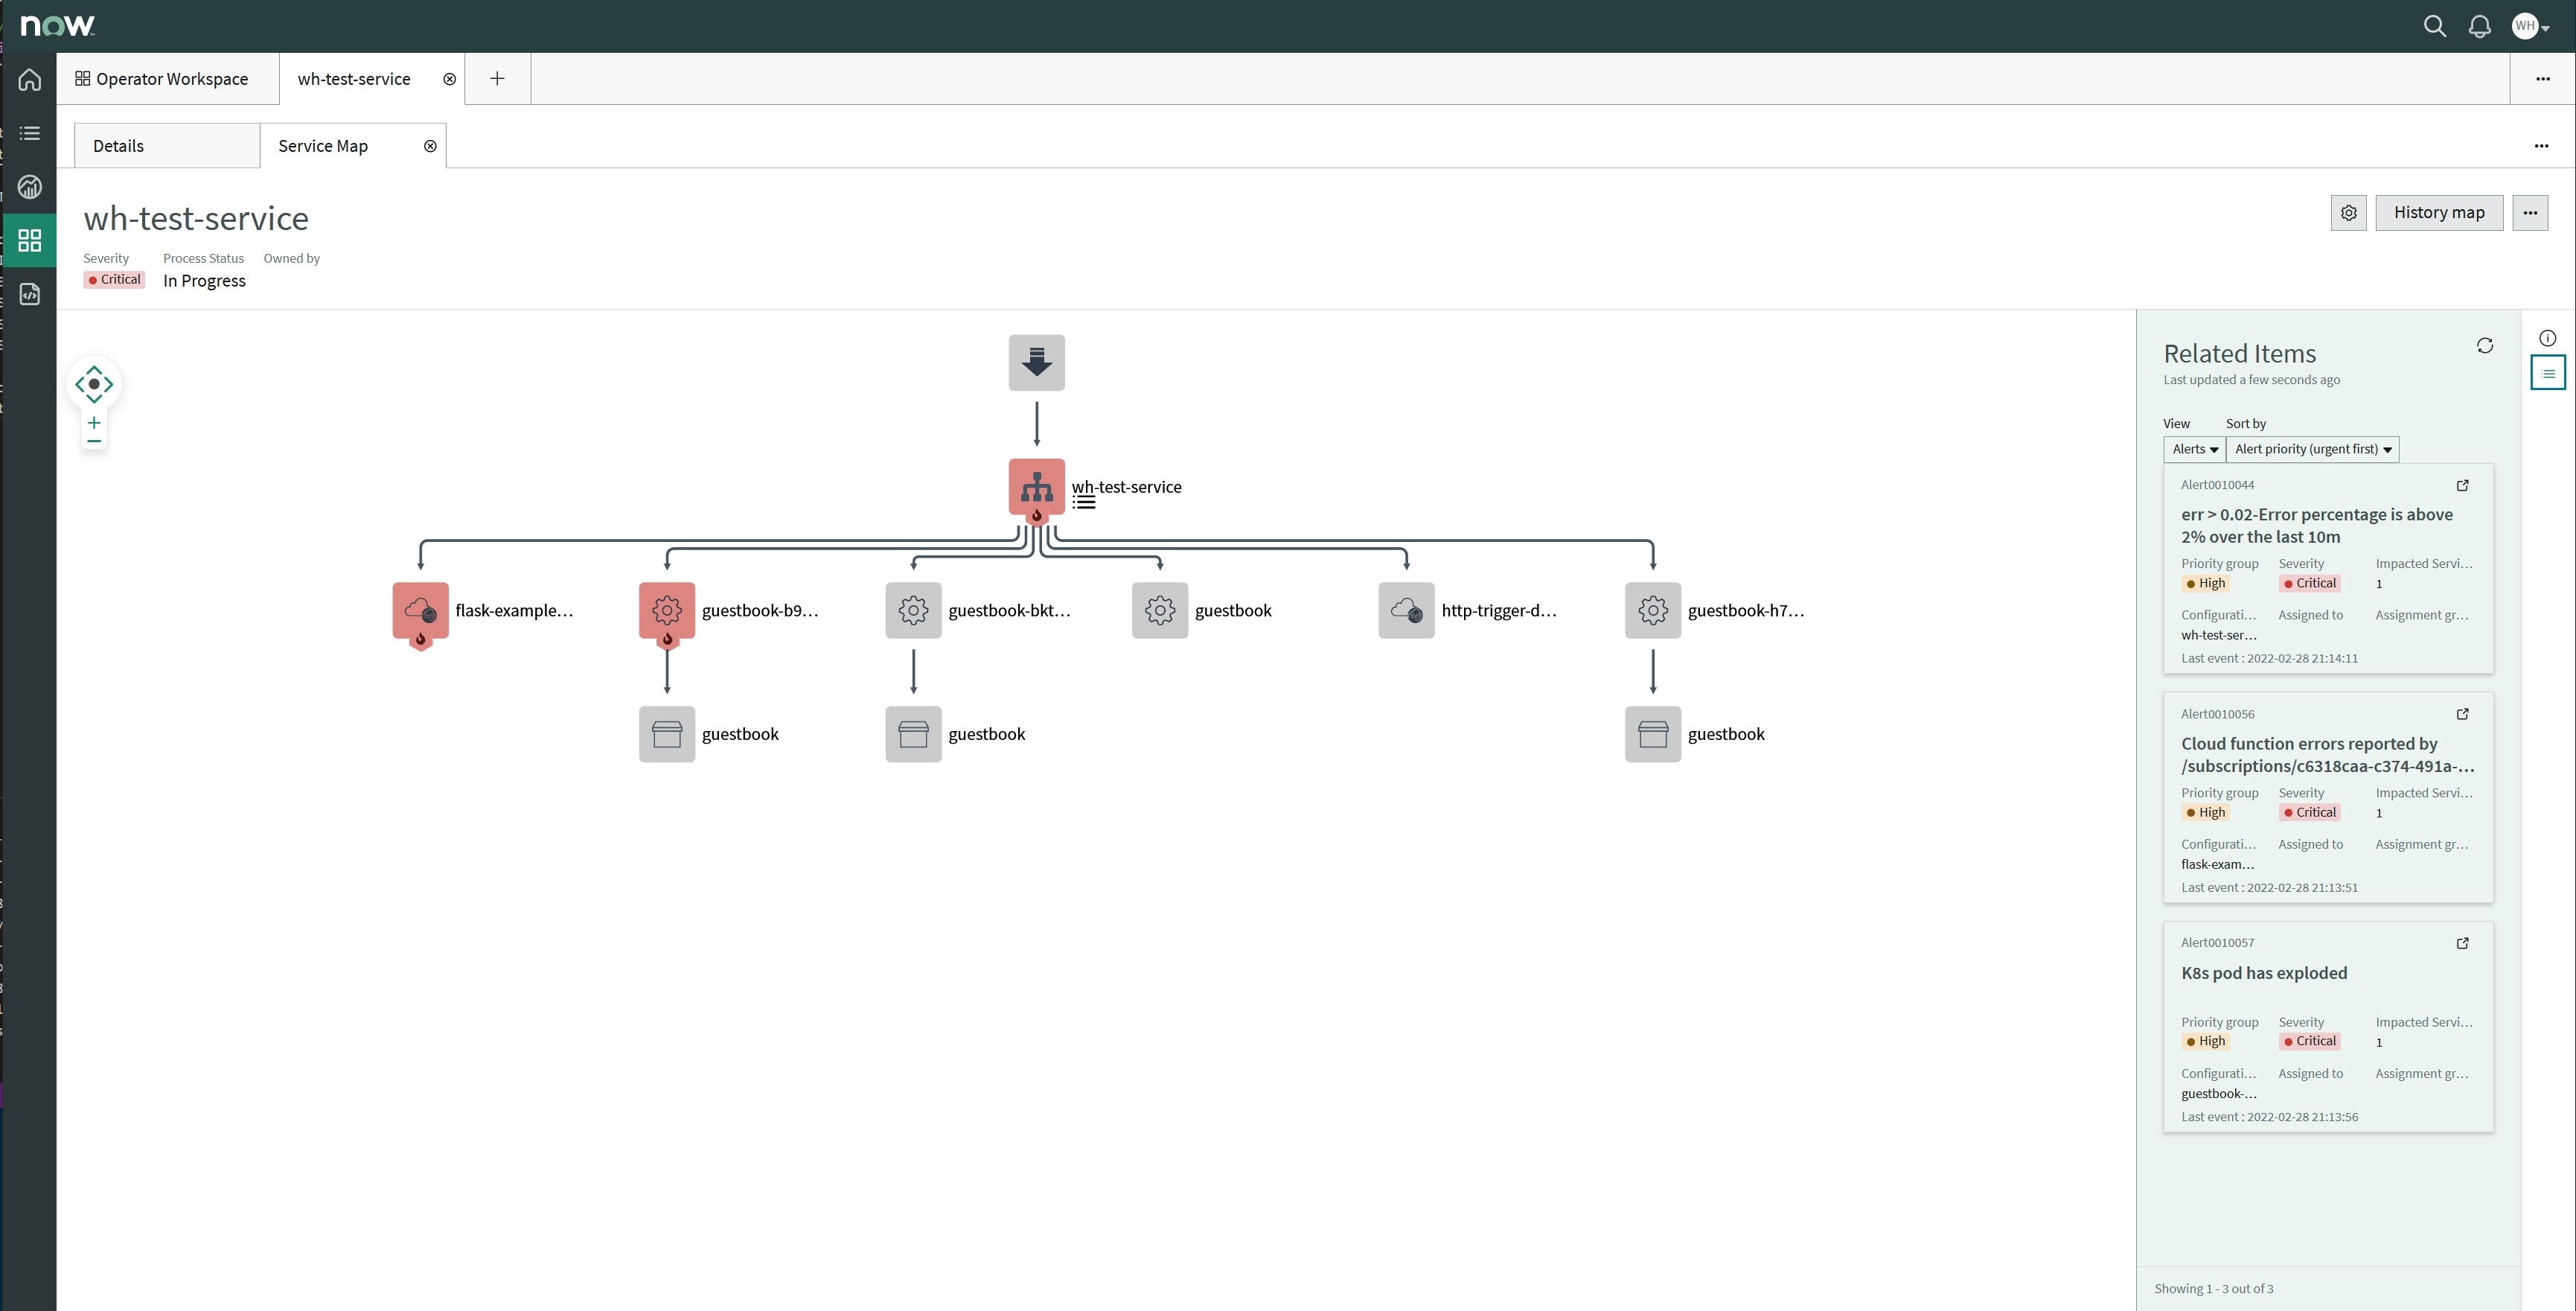
- Bring up the Service Map of the service, showing the various constituent objects

- Submit a simulated event which indicates a critical issue on a Kubernetes pod
- Submit a simulated event which indicates a critical issue with an Azure function

- Start a test script which sends a mix of erroneous and valid transactions to the Flask web service
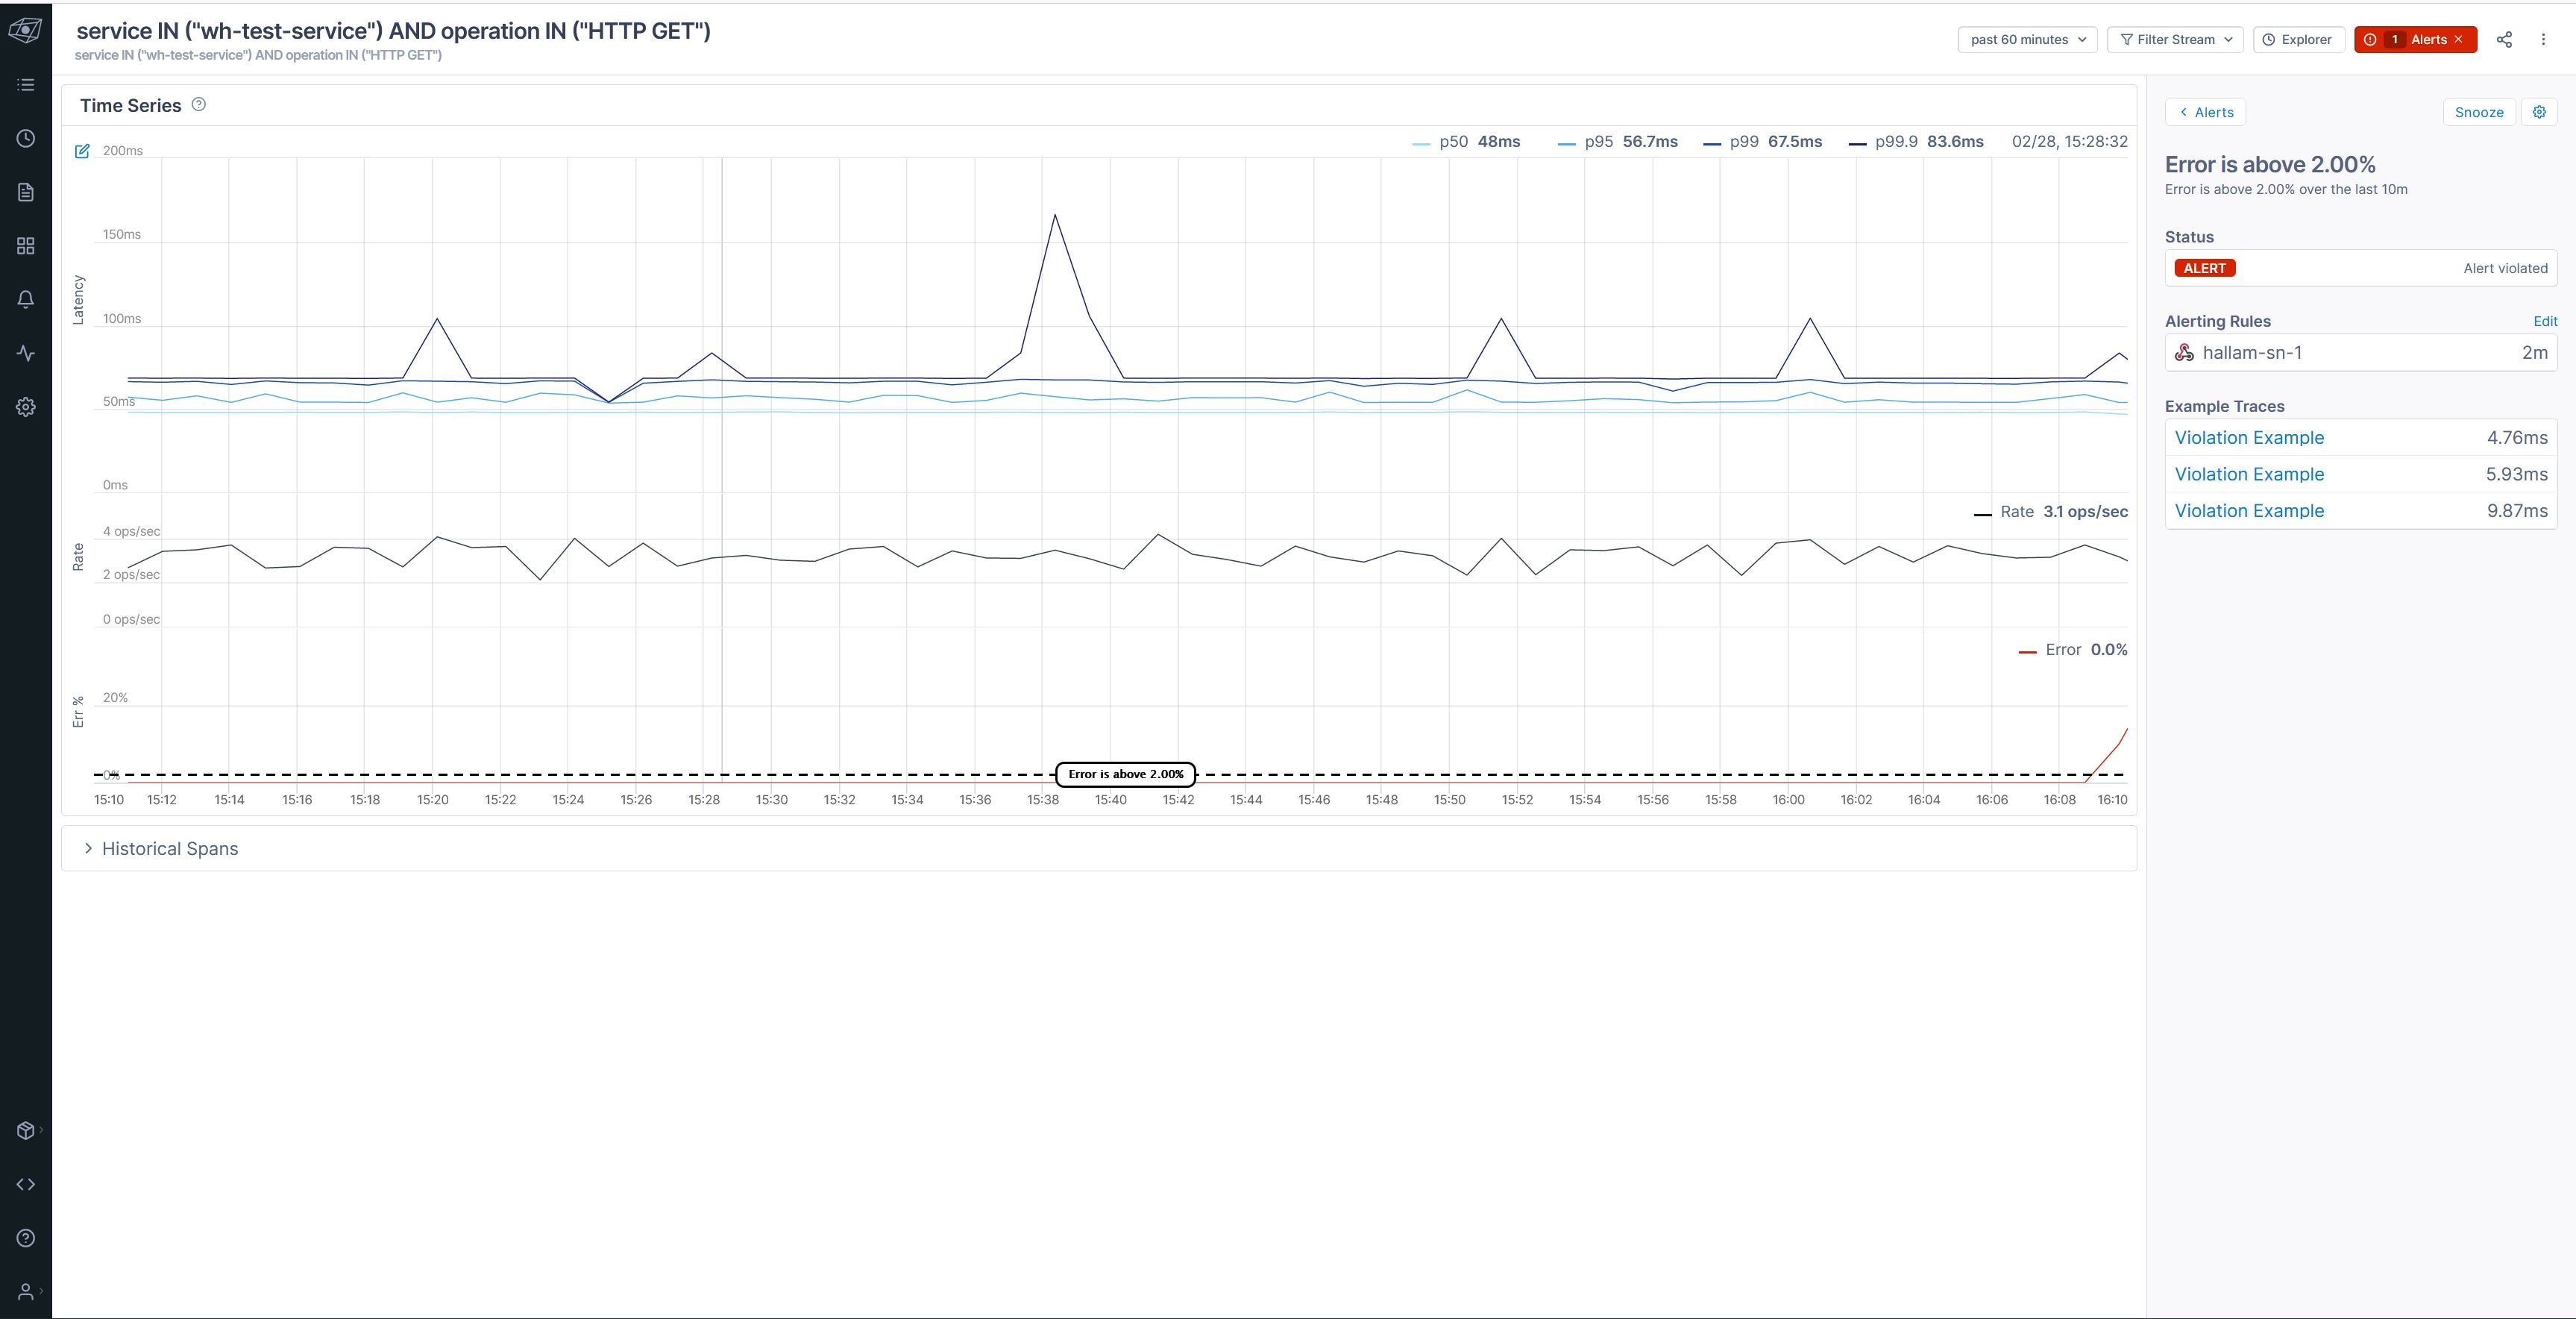
Shortly after performing these steps, I can see the service alert in Lightstep and the status of service "wh-test-service" going to red/"Critical" in the Operator Workspace.


Moving to the Service Map, I see each of the affected components flagged accordingly.

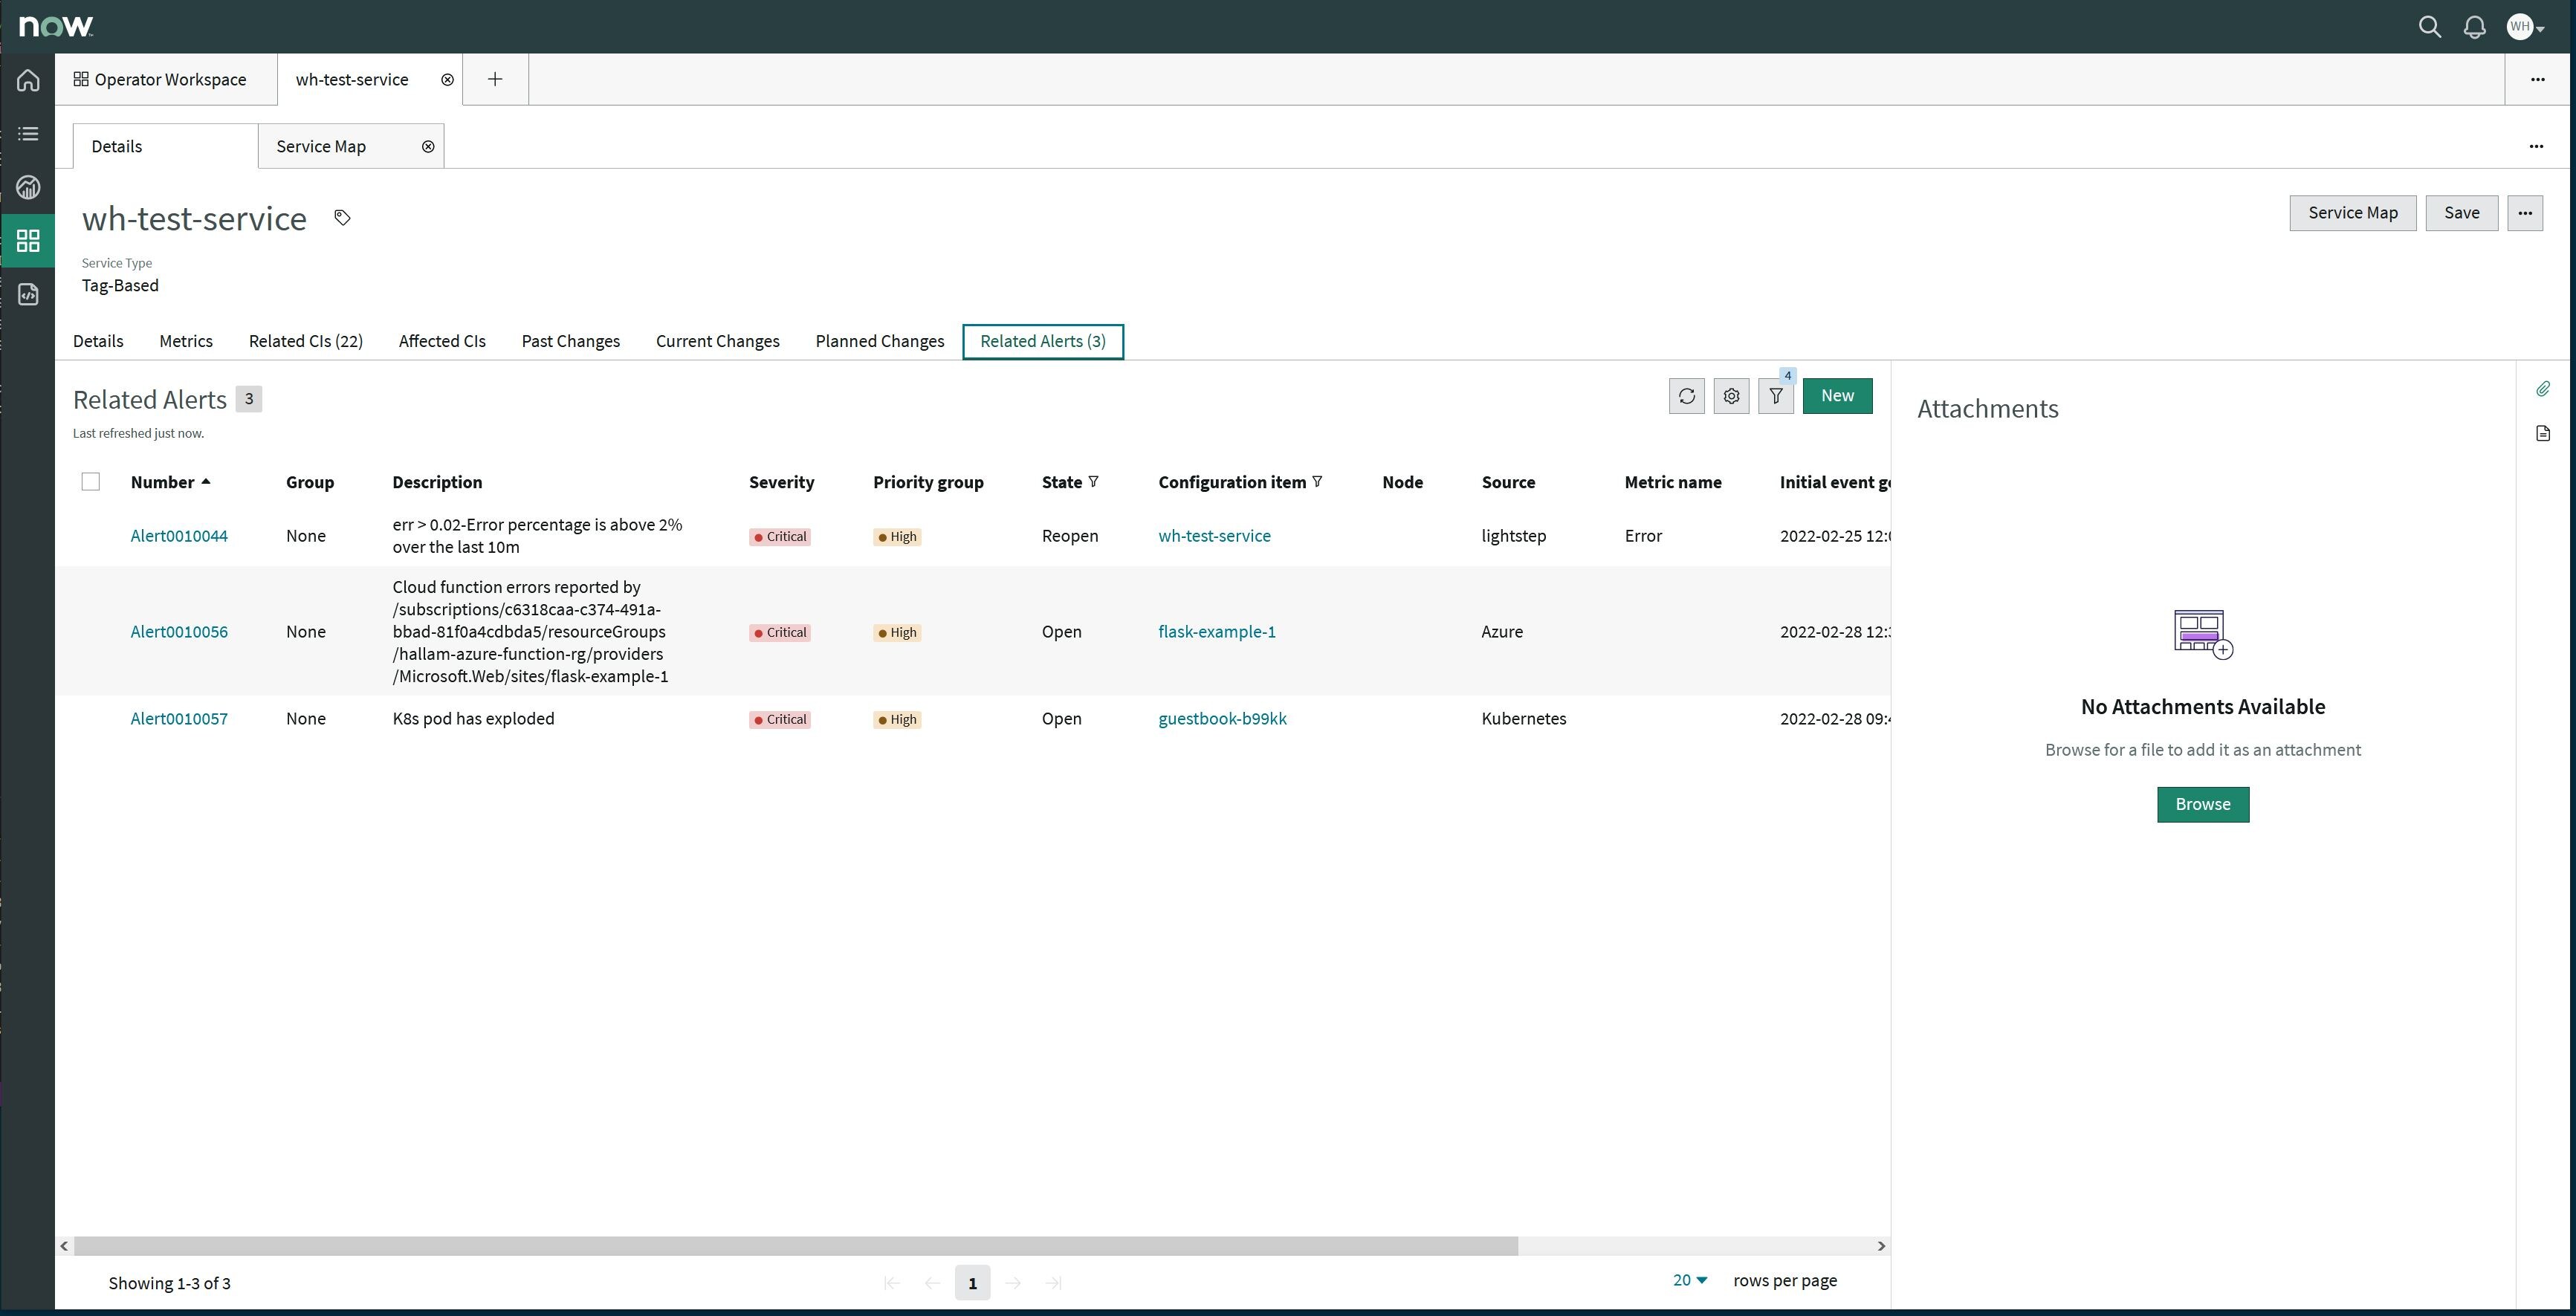
Viewing the "Related Alerts" tab automatically correlates each of the separate Alerts into one place.

This automatic correlation can reduce MTTR and root cause determination by drawing all the puzzle pieces together in one place.
- 1,660 Views
- Mark as Read
- Mark as New
- Bookmark
- Permalink
- Report Inappropriate Content
Learn more about OpenTelemetry here