- Post History
- Subscribe to RSS Feed
- Mark as New
- Mark as Read
- Bookmark
- Subscribe
- Printer Friendly Page
- Report Inappropriate Content
on 01-08-2021 10:54 AM
Discovery: ServiceNow Discovery finds applications and devices on your network, and then updates the CMDB with the information it finds.
Discovery finds computers, servers, printers, a variety of IP-enabled devices, and the applications that run on them. It can then update the CIs in your CMDB with the data it collects.
Horizontal discovery and top-down discovery
1) Horizontal Discovery - Horizontal discovery is a technique that Discovery uses to scan your network, find computers and devices, and then populate the CMDB with the CIs it finds. Horizontal discovery does create direct relationships between CIs, such as a runs on relationship between an application CI and the actual computer CI that it runs on. Horizontal discovery is not aware of business services and does not create relationships between CIs based on the business service they are in.
2) Top-down discovery- Top-down discovery is a technique that Service Mapping uses to find and maps CIs that are part of business services, such as an email service. For example, top-down discovery can map a website business service by showing the relationships between an Apache Tomcat web server service, a Windows server, and the MSSQL database that stores the data for the business service.
Plugins required for discovery:
Typically, Service Mapping and Discovery work together to run horizontal discovery first to find CIs, and then top-down discovery to establish the relationships between business services that you need to know.

Probes and sensors -Basically, probes and sensors are scripts that collect and process data on a host and then update the CMDB.
- Specifically, probes explore or investigate CIs on your network,
- Sensors parse the data returned from the probes.
Several probes and sensors are provided by default, but you can customize them to find different information, or you can create ones.
Patterns - Patterns, like probes and sensors, are a series of operations that also collect data on a host, process it, and update the CMDB. Patterns differ from probes and sensors in that they are written in Neebula Discovery Language (NDL) rather than JavaScript, and they are called into action in the later stages of the horizontal discovery process. Default patterns are provided, but you can also customize or create patterns using the Pattern Designer.
Difference between Probes and Patterns
Probe-based discovery and pattern-based discovery use different mechanisms of saving data in the CMDB. Using both discovery methods together may result in duplicate data in the CMDB. In addition, pattern-based discovery relies on relationships, while the legacy probe-based discovery uses references.
Horizontal discovery phases
The horizontal discovery process passes through the four phases of discovery using probes, which gather information on the target machine, and then sensors, which help Discovery determine what to do with that information.
Kicking off Discovery
A user triggers horizontal discovery by configuring a discovery schedule or by launching an on-demand discovery with Discover now or Quick Discovery. The schedule specifies one or more IP addresses or range of IP addresses.
Scanning phase
• Discovery first takes the Shazzam probe (and then port probes) and places it in a request in the External Communication Channel (ECC) queue.
• The MID Server checks the ECC queue, retrieves the discovery request, and runs the probes against the host and discovers open ports.
• The port probes scan common ports using several protocols, such as WMI, HTTP, SSH, and SNMP.
• If one or more ports respond, the Shazzam probe sends information about the port back to the ECC queue through the MID Server.
• Discovery checks the ECC queue to find out which ports responded, which identifies the type of machine. For example, if Shazzam detects that the machine is listening on port 22, Discovery treats the machine as a UNIX or Linux machine.
Classification phase
- The Discovery application determines which classification probe to send to the newly discovered device by using information in the record of the port probe that successfully responded.
- Discovery puts the classification probe into the ECC queue.
- The MID Server checks the ECC queue, retrieves the discovery request, and runs the classification probe.
- The classification probe retrieves additional information, such as which version of the operating system is running on a machine. This information determines the class of the CI that Discovery found. There is only one classification probe per discovered device.
- The classification probe sends information back to the instance ECC queue through the MID Server.
The Identification phase
- Discovery determines which classifier to use based on the class of the CI and the criteria specified in all CI classifier records. The classifier specifies which probes to use for the next two phases.
- Discovery puts the identification trigger probe for the CI classifier into the ECC queue. For example, a Unix machine running HP-UX would require the HP-UX classifier, which specifies that the Multi Probe-HP-UX Identity identification trigger probe. These probes use identification rules to determine whether or not to insert or update a CI in the CMDB.
Note: The trigger probe could also be the Horizontal Pattern probe, which tells Discovery to follow the operations in the specified pattern, rather than sending out additional probes. The operations in the pattern cover both the identification and exploration phases. Discovery knows which identification rules to use based on the CI type, and Discovery makes inserts or updates to the CMDB based on these rules. Probes and sensors are not used.
- The MID Server checks the ECC queue, retrieves the discovery request, and runs the identification trigger probe.
- The identification probe accumulates identification data for each device and sends that data back to the instance via the MID Server.
- Discovery uses sensors for the identifier probe to process the information.
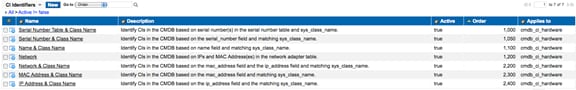
- Discovery performs the analysis on the CMDB using CI identifiers. Discovery can update existing CIs in the CMDB or create new ones.
The Exploration phase
- Discovery looks at the Triggers Probes related list in the classifier to find exploration probes to run.
- Discovery puts the exploration trigger probe into the ECC queue.
- The MID Server checks the ECC queue, retrieves the discovery request, and runs the exploration trigger probes.
- The probes send data back to the instance via the MID Server and sensors make updates to the CMDB, just as in the identification phase.
Discovery communication through MID Servers
A MID Server, which constantly queries the instance for probes to run, executes the instructions in the probe or in the pattern that the probe specifies.
Types of discovery
Run this type of discovery to find the devices, computers, and applications on your network. This is essentially the standard type of discovery that you run most often.
|
Type |
Description |
|
Network discovery |
Run this type of discovery to find the internal IP networks within your organization. If you already know the IP address ranges in your network, it is not necessary to run network discovery. |
|
CI discovery |
Run this type of discovery to find the devices, computers, and applications on your network. This is essentially the standard type of discovery that you run most often. |
|
Cloud discovery |
Run this type of discovery to find AWS and Azure resources in your organization's cloud. |
|
Serverless discovery |
Run this type of discovery to find applications on host machines without the need to discover the host first. Serverless discovery relies on patterns to explore CIs on a host. |
You can find this info in discovery schedule
Steps to do discovery:
1) In Discovery schedule you can do New, Quick discovery or cloud discovery

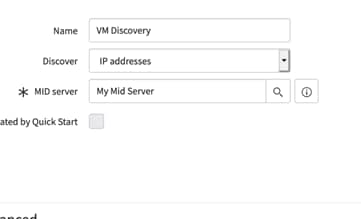
- Clicking New will open following screen

In this example I will only do IP address discovery -Shazzam
- You should be now ready to do discovery. You would need to setup IP range for discovery.
- You should see the following screen


Discovery Troubleshooting
The number one best practice in understanding the troubleshooting discovery is having a firm understanding of the four main stages of the discovery itself Port Scanning, Classification, Identification and Exploration. Each follows the other because of a positive result, just like dominos falling if the line stops at a certain point its because something didn’t happen the step before.
Port scanning
Port scanning is the very first step in the discovery process. In this stage we scan the defined IP’s for TCP and UDP IP ports looking for specific responses, namely that the port was open or responsive. The six main ports we check by default are
TCP
- 135 – (epmap) looking for the potential of WMI or Windows systems
- 22 – SSH looking for potential Unix Systems
- 80/443 – HTTP/s Looking for potential web servers
UDP
- 161 – SNMP we send a single OID query (sysdescr) looking for a response from potential network devices
- 53 – DNS we query the locally configured DNS server to resolve the name of each IP
- 137 – NetBIOS we query the local domain to also resolve the name of the IP
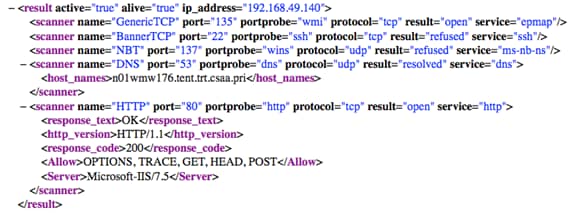
In scanning the IP Ranges we look primarily for responses from WMI, SSH and SNMP. When we see an IP has a state of OPEN for any of these three ports we move onto the next phase of discovery, classification. If we get no response we do not list it and if we get some response other then open we identify the same. Results can be found in the input of the ‘Shazzam’ probe of your scan.

In the example above, you would see that this is most likely a windows system for it has port 135 in a state of ‘open’ but we’ll find that out for sure when our classifier probe fires next.
If you are not getting expected returns or any returns from IP’s that you have been told that are a particular system, your best practice is to “walk up” the OSI model and this crosses all stages of discovery
Remember all troubleshooting should be done from the MID Server host for a direct comparison to how the MID Server is gathering the information.
Tests you can run to validate network connectivity to confirm your port scanning results.
- Use PING to see if you can ‘see’ the host on the network (ping <host>)
- If no ping response, use TRACEROUTE to see where traffic might be stopped. (traceroute <host>)
- Use TELNET to see if you can connect to any of the TCP ports (telnet <host> <port>)
- Use a SNMP scanning tool to see if a potential network device is responsive
Most likely issues around network connectivity are:
- Routing – perhaps the MID Server host does not have network access to the IP ranges you are looking to discover
- Firewalls
- ‘Physical’ – Firewalls that protect a large environment such as the Data Center.
- ‘Logical’- Software firewalls that protect and individual computer
- (SNMP) Access Control List (ACL) are an IP based list on network devices that allows communication to a particular target
Resolution of these issues will best be worked with your network teams to better understand your topology and possible deployment of additional MID Servers to help keep your network secure and or configuration to networking components to allow access from your existing MID Server host.
Classification
Once we see an open classification port (WMI/SSH/SNMP) we then trigger a classification probe to the specific IP for the specific protocol. This is also the first time we use credentials for this is our first application query to the target. We classify computers based on Operating System (OS), Network Devices based on their capabilities.

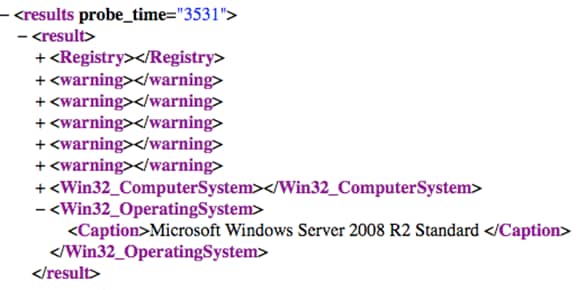
Above is a sample return of a classifier probe as you see when successful we will gather the OS caption matching specific criteria, which would then move us onto our third phase of discovery identification. But in troubleshooting classification error.
Windows
If you are having issues with a windows classifier probe returning the most likely causes are:
- Credentials
- Logical Firewall
- WMI Application performance/availability
Credentials (authentication failures)
To validate your credentials on windows systems you would want to log into your MID Server’s host (if possible) as the same user that Discovery is attempting to use. The majority of issues are normally credential related.
Logical Firewall (Could not connect to WMI Service)
In WMI communication it’s important to remember that traffic only initiates on port 135. When two Windows Operating systems ‘talk’ WMI they actually negotiate unused “high” ports to finish the conversation. This presents a problem for logical firewalls in windows systems for normally they will allow port 135 to be seen as it is with our port scan probe but block the high ports that we need to communicate. To overcome this you can configure the firewalls to allow any port any protocol from your MIDServer’s host, using the WMI script that can be run locally or other options such as locking down WMI to specific ports.
It is absolutely recommended that any system configurations should absolutely be evaluated and determined by your local security policies and processes.
WMI Application
It’s not unheard of to find a particular windows application to stop performing as expected when all else has been validated restart the OS to eliminate any residual potential issues (if possible)
Additional troubleshooting resource for windows systems
UNIX/Linux Systems
When a Unix Classify probe is having problems your most likely causes are:
- Credentials
That the great thing about Unix Systems the most likely issue is just that, credentials. There are rare cases where your Unix systems may have local ACLs similar to Network devices or even logical firewalls but these are very few and far between.
When to help diagnose these issues use a third-party application such as putty (or your preferred ssh client, from the MID Server host) to confirm the credentials discovery is attempting to use. You can also enable additional logging to assist with your troubleshooting
Network Devices
When diagnosing potential network device issues the most likely causes are:
- Credentials
- Access Control Lists (ACLs)
Credentials are straight forward be sure that the MID Server has the appropriate ‘Read only’ string in the credentials table (we try ‘public’ by default’).
Routers, powering devices, switches and even some printers however can utilize Access Control lists that limit which IPs are allowed to make queries to the device. You want to be sure your MID Server’s IP is in that list.
Since you cannot ‘telnet’ to a UDP port you would want to use a third-party query tool such as iReasoning (or your tool of choice) from your MID Server host to validate the proper credentials and ACL Access.
Overall Classification
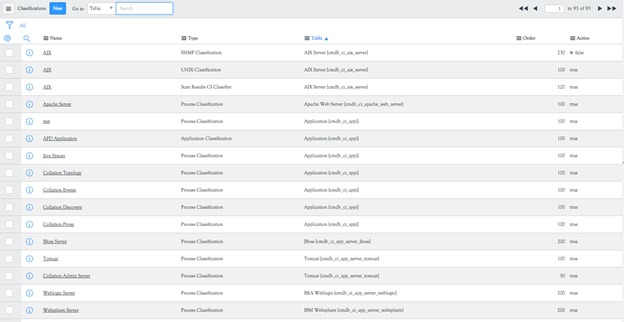
If you were able to gain access to your system but the device is still not ‘classifying’ then you should ensure that you have an actual classifier for that device that either meets specific criteria. This is most common with Network gear that may not be out-of-box in the ServiceNow product.

Additional Debugging information can be added to the sys_properties table to assist in any troubleshooting. By adding a ‘glide.discovery.debug.classification’ true/false property with the value of ‘true’ we will add additional information to the system log to help with classification issues.
Identification
Once you have a met a classification criteria for any device the next phase of discovery is identification, identification is the process where before we create or update anything in your CMDB we ensure we are doing so with the best measure. One of three things can happen in the identification phase where we look to find a complete match based on these rules

- We find no complete match where we will create a CI
- We find a single complete match where we will update a CI
- We find multiple matches based on a complete match where we will stop discovery for that IP and log the event
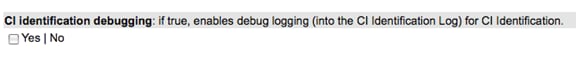
There isn’t much to troubleshoot here besides event #3, multiple matches. This is where you would go into the CMDB and identify who is creating multiple matches and of course stop that from happening. The primary culprit is usually imports from external data sources whose coalescing rules may not be as tuned as they should be. In our properties section you can add additional logging for ci identification process that will be written to the discovery log for each IP

Exploration
Once you are at the exploration phase you have full access to your systems and are now going to be populating data. There isn’t much troubleshooting to do in the phase other then identifying one off probes and sensors that you may have issues with access to specific unique areas such as directory access, file systems and unique commands that may not execute due to permission issues. These can all be found in the discovery log.
Processing
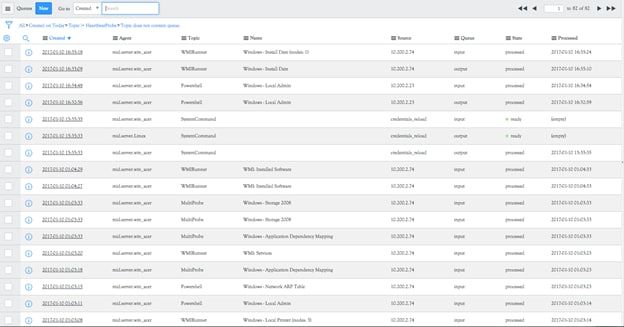
All work is processed in and out of the ECC Queue and can be identified on each discovery status record.

In the ECC queue can identify the 4 phases of discovery that are executed for each device. Port Scanning (Shazzam), Classify, identify and exploration. The ecc queue has two Queue column values and four State column values.
State
- Output
- Input
Queue
- Ready
- Processing
- Processed
- Error
‘Errors’ for input and output records are rare. Ouput – error records should never be seen if so, there has been major changes to the moving pieces and parts of your discovery application. Input – error records are not uncommon especially when creating your own probes and sensors. This usually means the system couldn’t parse the XML return with the sensor script. In any error response the details section will provide information to where the issue might be
An overall discovery process follows the same path each time for each probe.

- An output – ready record (probe) is created in the ecc queue, tasked to the appropriate MID Server (agent)
- Once the MIDServer has collected the request it changes the record to output – processing
- When the MIDServer completes the task it creates an input – ready record
- The output – processing record is then updated to output – processed
- The input – ready record is then collected by the system and is updated to reflect an input – processing
- When the data is finished being entered into the CMDB the system updates the record to an input – processed state
Identifying where the processing is taking place is the best way of identifying any bottlenecks and processing issues. Let’s identify some common scenarios
Schedule sits in a ‘starting’ state –
- Is the System Scheduler backed up with other system jobs, is it running?
Schedule is active but the shazzam probe is in an output - ready state for longer then 15 seconds
- Check the state of the MID Server it is most likely down or requires a restart
Schedule has been running and is active but there is no movement of Output probes, seems stalled.
- Ensure you are giving the appropriate time for the probes to process.
- Check the state of the MIDServer could be down or requires a restart
Schedule has been running and is active but there is no movement on the input probes, specifically the input – ready entries.
- Confirm the scheduler is running and is not backed up
You can see scheduler stats by going to System Diagnostics > Stats

Confirming this input processing information is valuable to give you piece of mind any work that needs to be done to resolve will have to be completed by Customer Support.
- 118,454 Views
- Mark as Read
- Mark as New
- Bookmark
- Permalink
- Report Inappropriate Content
Excellent Effort Sir,,,,Please try to post on more on Discovery Patterns as well
Thank you for posting such a wonderful article...keep it up.
- Mark as Read
- Mark as New
- Bookmark
- Permalink
- Report Inappropriate Content
I thought this looked familiar. Glad to see my good work finding new voices, as they say, imitation is the sincerest form of flattery! 🙂 Appreciate you getting this back out there...

I see one commenter talked about patterns and yes, I have been remiss on updating the doc to include those and hopefully will find some cycles to get that published as an addendum. In the meantime, while a little dusty the foundations of these practices still ring true. Probes and sensor development have gone by the wayside but the core functionality, troubleshooting practices, and mid-server/schedule configurations are guides that I still use today.
- Mark as Read
- Mark as New
- Bookmark
- Permalink
- Report Inappropriate Content
Can't wait for the addendum!
- Mark as Read
- Mark as New
- Bookmark
- Permalink
- Report Inappropriate Content
@Veera1986 Thank you for your kind information,
I have a question. How can I obtain the failed CIs from discovery if they are within the specified IP range and when we do the discovery they are unable to be discovered for a variety of reasons? The discovery scheduler runs every time, so how can I obtain the failed CIs from discovery??
- Mark as Read
- Mark as New
- Bookmark
- Permalink
- Report Inappropriate Content
All time best discovery explanation on internet I have come across internet Thanks for your help
- Mark as Read
- Mark as New
- Bookmark
- Permalink
- Report Inappropriate Content
Thank you
- Mark as Read
- Mark as New
- Bookmark
- Permalink
- Report Inappropriate Content
- Mark as Read
- Mark as New
- Bookmark
- Permalink
- Report Inappropriate Content
this one saved my life this week 😀
- Mark as Read
- Mark as New
- Bookmark
- Permalink
- Report Inappropriate Content
i have created this post about ITOM Discovery that provides a step by step process, ITOM discovery architecture with full live demo.
ServiceNow Discovery: A Formal Business Case Study of IT Transformation
- Mark as Read
- Mark as New
- Bookmark
- Permalink
- Report Inappropriate Content
thanks a lot for valuable information sir, i have read many vedious in youtube but none of them explained as clear as you.