


Manjeet Singh

ServiceNow Employee
Options
- Subscribe to RSS Feed
- Mark as New
- Mark as Read
- Bookmark
- Subscribe
- Printer Friendly Page
- Report Inappropriate Content
08-31-2017
03:27 PM
One of the most important things about the survey process is reporting. If you are just sending out surveys and cannot gain feedback or insight from your participants, then the survey is not helpful. You can design your surveys in ServiceNow to easily report on your results.
When you send out a survey, ServiceNow creates a metrics results table (asmt_metric_results) for you in the background. We can leverage these metrics results, to view pre-made score cards and create our own reports and dashboards. Let's dive into these three ways:
3 ways to report on your survey results
- View Out of the box survey scorecard report
- View individual survey responses
- Create your own report/dashboards
View base system Scorecards
The scorecard view helps you quickly visualize the results of the survey based on a survey category or a survey question. The scorecard will show you results on a survey category, the ranking information and historical results view for last 3 years of results on the selected Survey. Follow these steps to see the scorecards based reports:
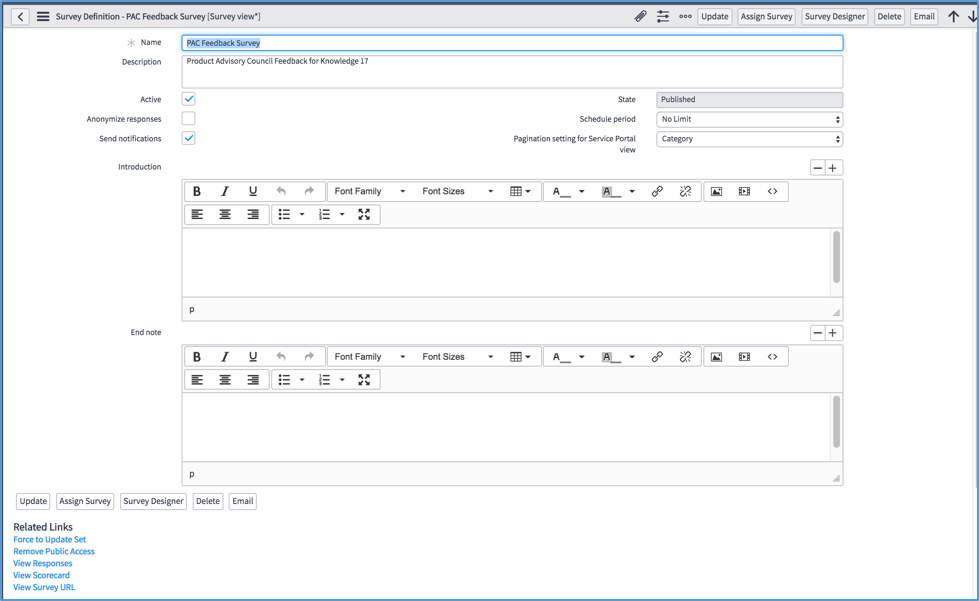
- Navigate to Survey Management > View Surveys. Select < Your Survey>
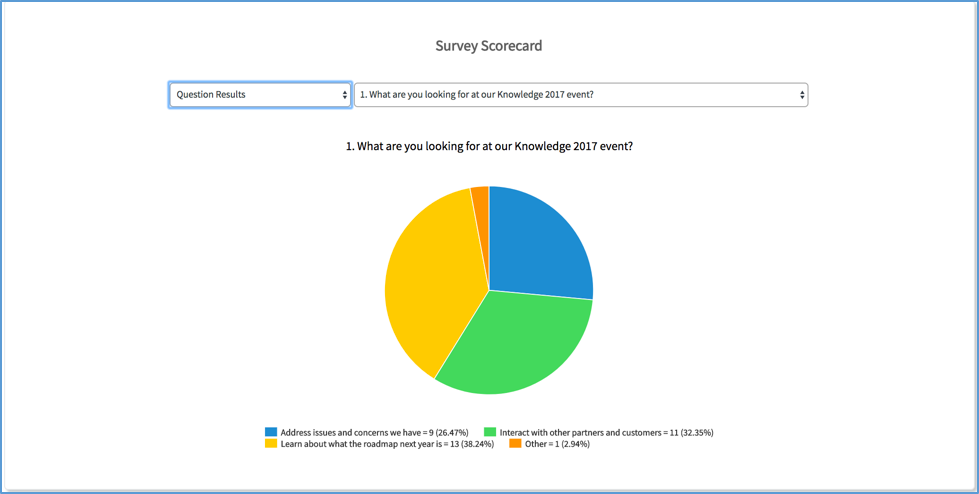
- Scroll to the bottom of the <Your Survey> Survey Definition form to see two new Related Links. Since you now have some submitted survey results, you can view them on a Scorecard or just view the raw results. Click View Scorecard.
- Switch from Category Results to Question Results to view the details on an individual question.

The Survey Scorecard can be shared with your leadership and can be adjusted to show the values your organization care about.
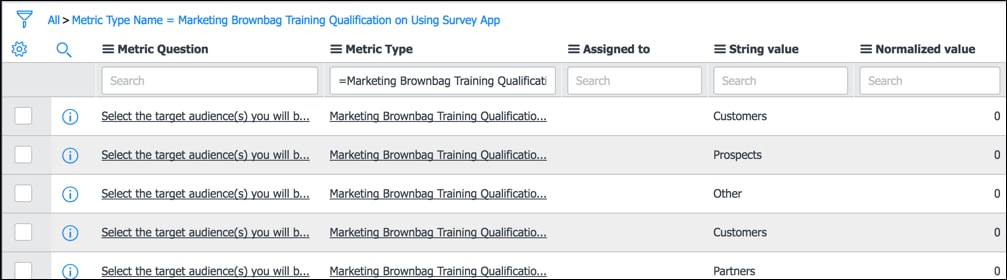
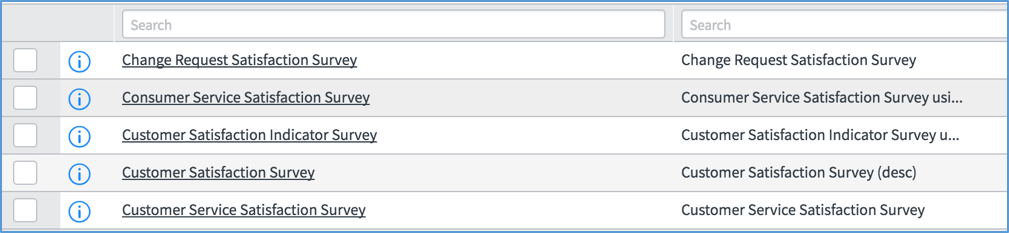
View Individual Survey responses
Survey responses help you to look all the survey results in a list view.
- In the Navigation panel type Survey
- Click view Survey
- Find your survey in the list on left side — scroll down to related list
- Click on View Responses to see a list of responses to this Survey
This is a granular view of the survey responses. Rather than seeing your responses lumped into a chart or graph, your data team can review and analyze each individual response to improve future survey projects.
Create a Report with Scores from the Survey
You can create your own Survey results reports if the scorecard and view responses do not meet your requirements. ServiceNow reporting enables you to create and distribute reports on the current state of Survey results data. The common use case is to create a report for a shared dashboard that can be used by the entire team. Follow these steps to create a category based report:
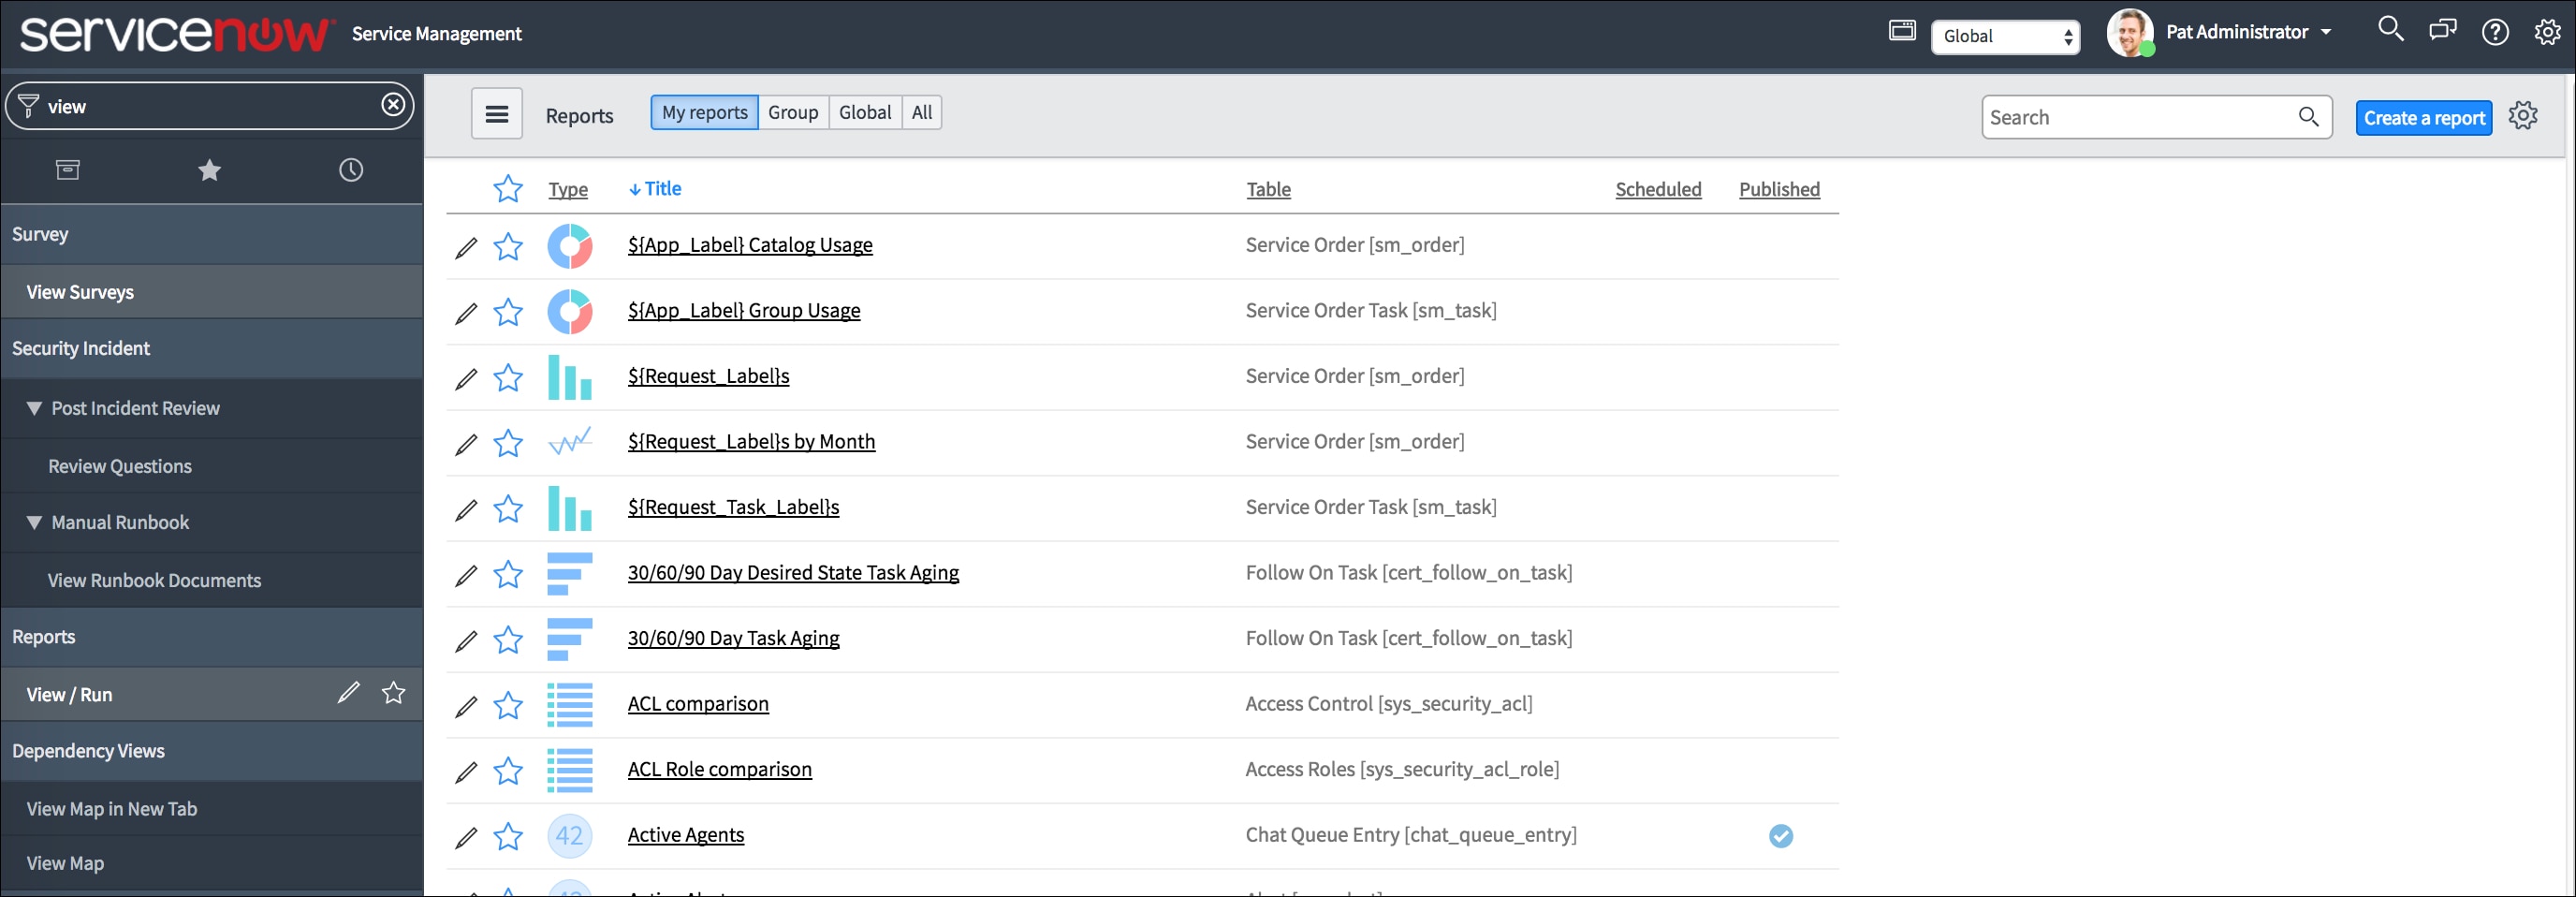
- In the navigation filter, type report.
- Select Create New.
- For the report name, type <Your Survey> Survey results.
- In the table field type Metric. Select metric result.
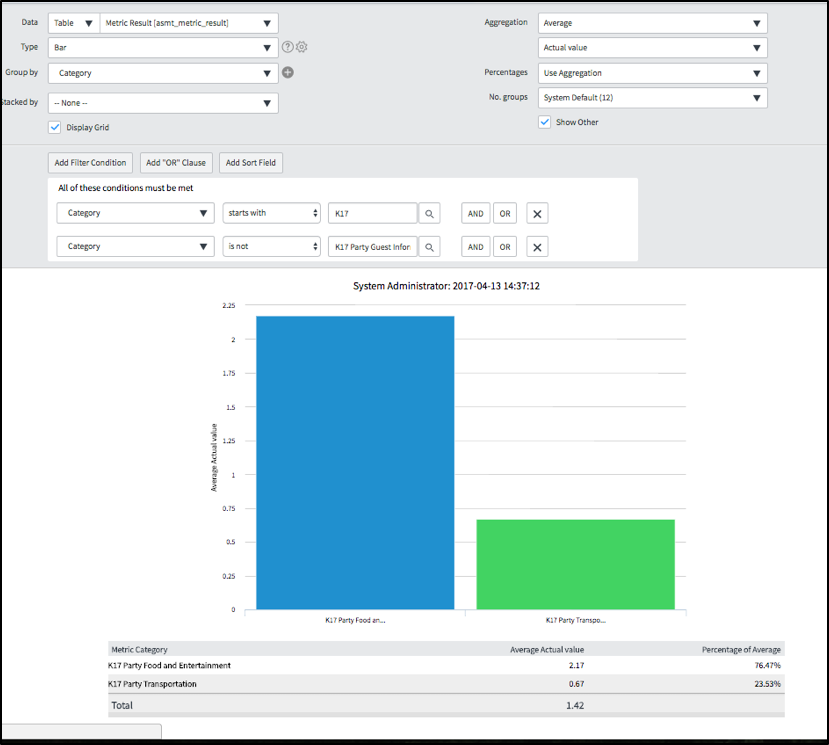
- In the Type field, select Bar.
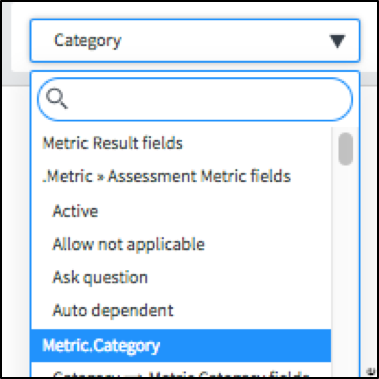
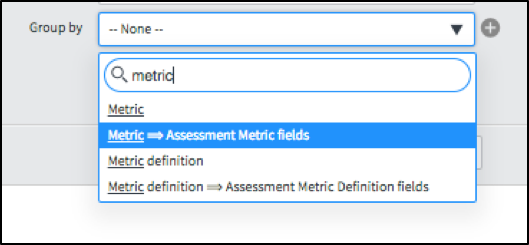
- Select Group by Metric > Assessment Metric Definition field. This is where the metric categories are listed.
- Now here is the trick: Select the Group by field a second time to see additional selections.
- Select Display grid.
- For Aggregation, choose average.
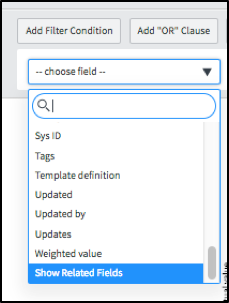
- Filter for the report. First you need to see some related fields again. To do this in the report filter, scroll to the bottom of the selections and choose Show Related Fields.
- Now when you select the drop-down menu a second time you see additional fields.
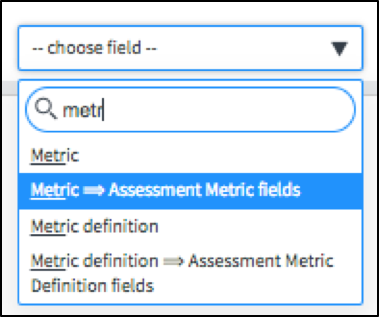
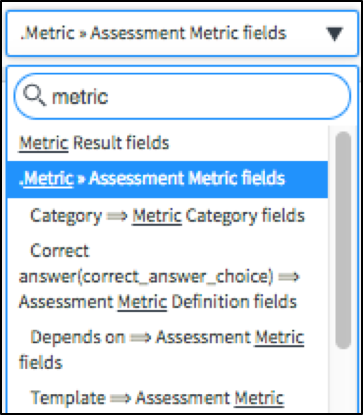
- Type metric and choose Assessment Metric field.
- Choose the field a third time to see the category listed.
- Select starts with and type K17.
- Click the And button to add an addition to the filters.
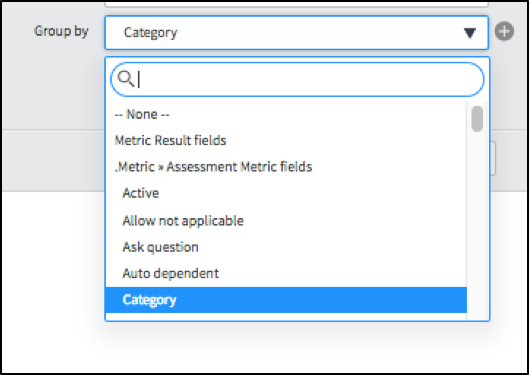
- Type metric a second time and select Assessment Metrics Fields.
- Choose it a second time and select category.
18. Select Run. to see the report. You can save this report and share it with others in your organization. You can add a report to a Dashboard or homepage.

Surveys and Assessments both provide some pre-canned reporting options. You can easily create your own reporting dashboard using ServiceNow reporting functionality or using Performance Analytics Dashboards. The main purpose of surveys is to help you know the customer satisfaction and service quality. Just sending out the Survey is not useful unless you can look at Survey results in an easy to consume report. Go ahead and try these reporting options and leave us your feedback in the comment section below.
- 103,728 Views
18 Comments
- « Previous
-
- 1
- 2
- Next »
You must be a registered user to add a comment. If you've already registered, sign in. Otherwise, register and sign in.
