- Subscribe to RSS Feed
- Mark as New
- Mark as Read
- Bookmark
- Subscribe
- Printer Friendly Page
- Report Inappropriate Content
We're continuing on with our reviews of the reporting hands-on labs. In the last session, we covered the basics of the reporting engine. In this lab, Pieter Goris (ServiceNow Developer) and Semhar Yemeneab (ServiceNow Solution Consultant) covered some advanced report management and creation techniques to take your reporting to the next level.
Again, reporting is a critical way to create visibility into a process in order to help you get proactive. But organizations that provide a robust reporting engine to their users can end up with unintended consequences.
Why Report Management Is Critical
As you start to create visibility into your processes with ServiceNow, you may give your users the power to create their own reports. This is a great thing because people will feel empowered to use the reporting engine to display data relating to their processes. But you need to consider some of the impacts of doing that:
- Report Proliferation: Left to their own devices, users will create reports for themselves. And they will then create a similar report with a slightly different view that is saved as a separate report. Then a new report will be created to share with a group of people. And so on . . . Before you know it, there will be hundreds of reports, and many of them will perform the same general function. This means people who need the data may not be able to find the right report, which will lead to a mistrust of the data.
- Single-Use/Unused Reports: Some of those newly created reports will only be used once by a user. And then those reports will sit there in the ServiceNow report list just taking up space. Reports need to be reviewed from time to time to ensure they are being used frequently, and that they are truly providing visibility into your processed.
- Heavy Use Reports: Some users that create reports may inadvertently create a query that takes a long time to complete. These reports may take up significant processing resources. Left unknown, these reports may cause performance issues in your environment and have you guessing why the platform is slow. It is important that you are able to identify all heavy use reports to understand their impact on the system.
Report Management In Fuji
If you are not yet on Fuji, you probably feel this pain. Fortunately, Fuji comes with many report management enhancements to help report administrators bring some order to the chaos. Pieter and Semhar covered the following report management items in their lab, and it was impressive:
- Configuration of Report Lists: Report administrators have the ability to see more information in the report list. Just click on the cog wheel in the upper-right of the report list to turn on additional columns of information about the reports. Just turn on the additional information you would like to see about the report including number of runs, last run, and recent run time.
- Easily Accessible Report Filters: Report administrators can quickly find the reports that are the most used or unused. This allows a report administrator to understand which reports are valuable to users and which reports are the "one and dones". These filters are at the top of the report page for the report administrator.
- Improved Report Searching: Not only can you find reports by title, you can now also find reports by the table they are configured to report on. As you know, people are not always correct in their descriptions of reports. But in Fuji you really can find all reports that use the Incident table through this new search feature.


These features are incredibly useful for report administrators to gain control over how the process visibility is being presented to data consumers. Check out these new report features in Fuji!
Report Creation Tips and Tricks
Pieter and Semhar then took students through a series of labs to show them some more advanced tips and tricks when having to create reports in ServiceNow. These are important "did you know" items that will help you in your report creation and administration as you create visibility for your process.
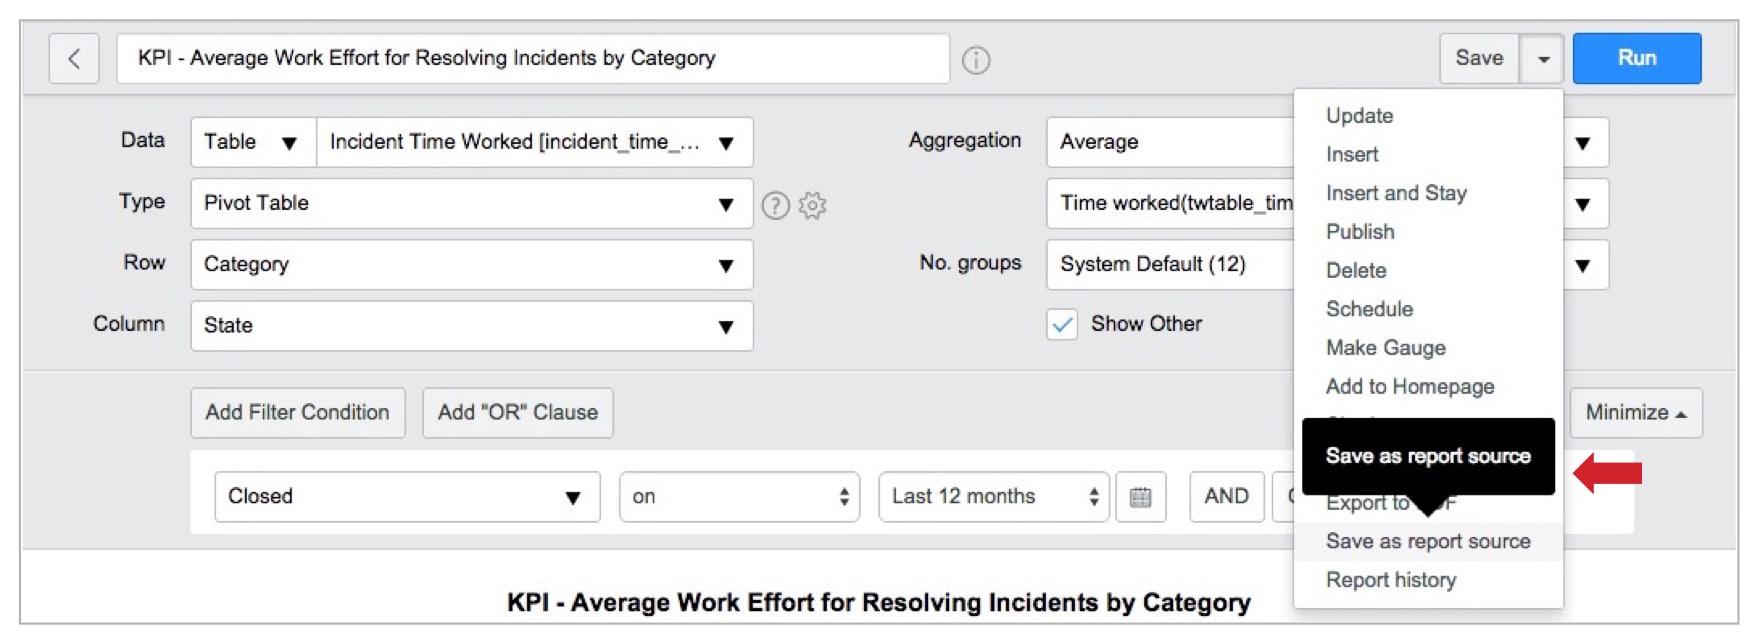
- Report Sources: You can use an existing report as a report source for another report. By using report sources, you can set up a "standard" set of reports based off of the same table and conditions. Think of the report source as a baseline for the creation of other reports. After you have set up the table and filters, just save it as a report source. When you create a new report, select Report Source in the Data drop down (instead of Table). Your new report will point at the Report Source.
- Dot-Walking: Dot-walking was covered in Reporting 101, but it is such an important concept, it was covered here again. Use dot-walking to incorporate data from other tables into your report or lists. You really need to be comfortable with this concept to create the most meaningful reports because visibility and insight are most often achieved when data across multiple tables are displayed in a single place.
- Reporting on Variables: Have you wanted to create a report that showed you all of the requests in your service catalog for a specific variable but found it too complex? For example, say you want to report all of the iPhone 5's that were ordered with a 12 or 18 month service contract. It used to be hard. It's not any more! You can now report on variables and through the UI select the specific variable values you want to see in the report. This is a very powerful feature to really drill down into specific data and understand request consumption.


Turning On Performance Analytics
After covering the reporting section, Pieter and Semhar provided instructions on how to turn on the Data Collector for the complimentary (yes, free!) version of Performance Analytics that comes with every instance since Eureka. Most people don't know that you have the ability to start gathering trend information about your Incident Management process right out of the box with ServiceNow. All you need to do is turn on the Data Collector if you are using ServiceNow's standard data fields to support your Incident Management process.
Rather than making this blog entry any longer than it needs to be, I will dedicate a separate blog post to detail the steps to getting the complimentary version of Performance Analytics running in your own instance. You will be on your way to getting proactive!
You must be a registered user to add a comment. If you've already registered, sign in. Otherwise, register and sign in.
