- Post History
- Subscribe to RSS Feed
- Mark as New
- Mark as Read
- Bookmark
- Subscribe
- Printer Friendly Page
- Report Inappropriate Content
on 03-30-2022 07:51 AM
Overview
This guide is written by the ServiceNow Technical Support Performance team (All Articles). We are a global group of experts that help our customers with performance issues. If you have questions about the content of this article we will try to answer them here. However, if you have urgent questions or specific issues, please see the list of resources on our profile page: ServiceNowPerformanceGTS
Since the London release the ServiceNow platform has included the 'batch REST API' endpoint - its documented here. Even though it's been around a while it seems that, talking to partners and customers, ServiceNow has done a really bad job of promoting this functionality and, as a result, barely anyone knows about it.
Whilst it's true that you don't necessarily need to use the batch REST API to achieve your outcomes with the platform it is something which can be useful and, in specific circumstances, has the ability to dramatically increase the performance and scalability of your implementation. Who wouldn't want to do that?
An Introduction To Batch REST
The batch REST API is talked about in various places but rather than just giving you a load of links lets very quickly recap:
- Question: What is the batch REST API?
- Answer: Its an out of box REST endpoint within the ServiceNow platform to which you can send a single request containing multiple REST API calls and get a stream of response payloads back
- Question: Why would you use the batch REST API?
- Answer: In terms of individual REST API call processing there is no difference between using batch REST and traditional REST endpoints - essentially you will get the same results (response payload) using either method. Where the batch REST API comes into its own, however, is when you need to perform a large number of REST API calls in a short period of time - by batching all these requests you only need a single round trip over the network to the instance, you only need to authenticate once (assuming you are not already authenticated), and the instance only needs to spin up a single thread to deal with multiple REST API calls. This might not sound significant but the benefits can really add up - we'll look further into this later on
- Question: How do I make use of the batch REST API?
- Answer: On your client you need to build a JSON payload describing all of the API calls you wish to make within the instance. In the case of POST requests you also need to include a body which is base64 encoded - prior to encoding this body can be in the XML or JSON formats. Once the payload has been built simply send it to the /api/now/batch endpoint within your instance to execute the API calls
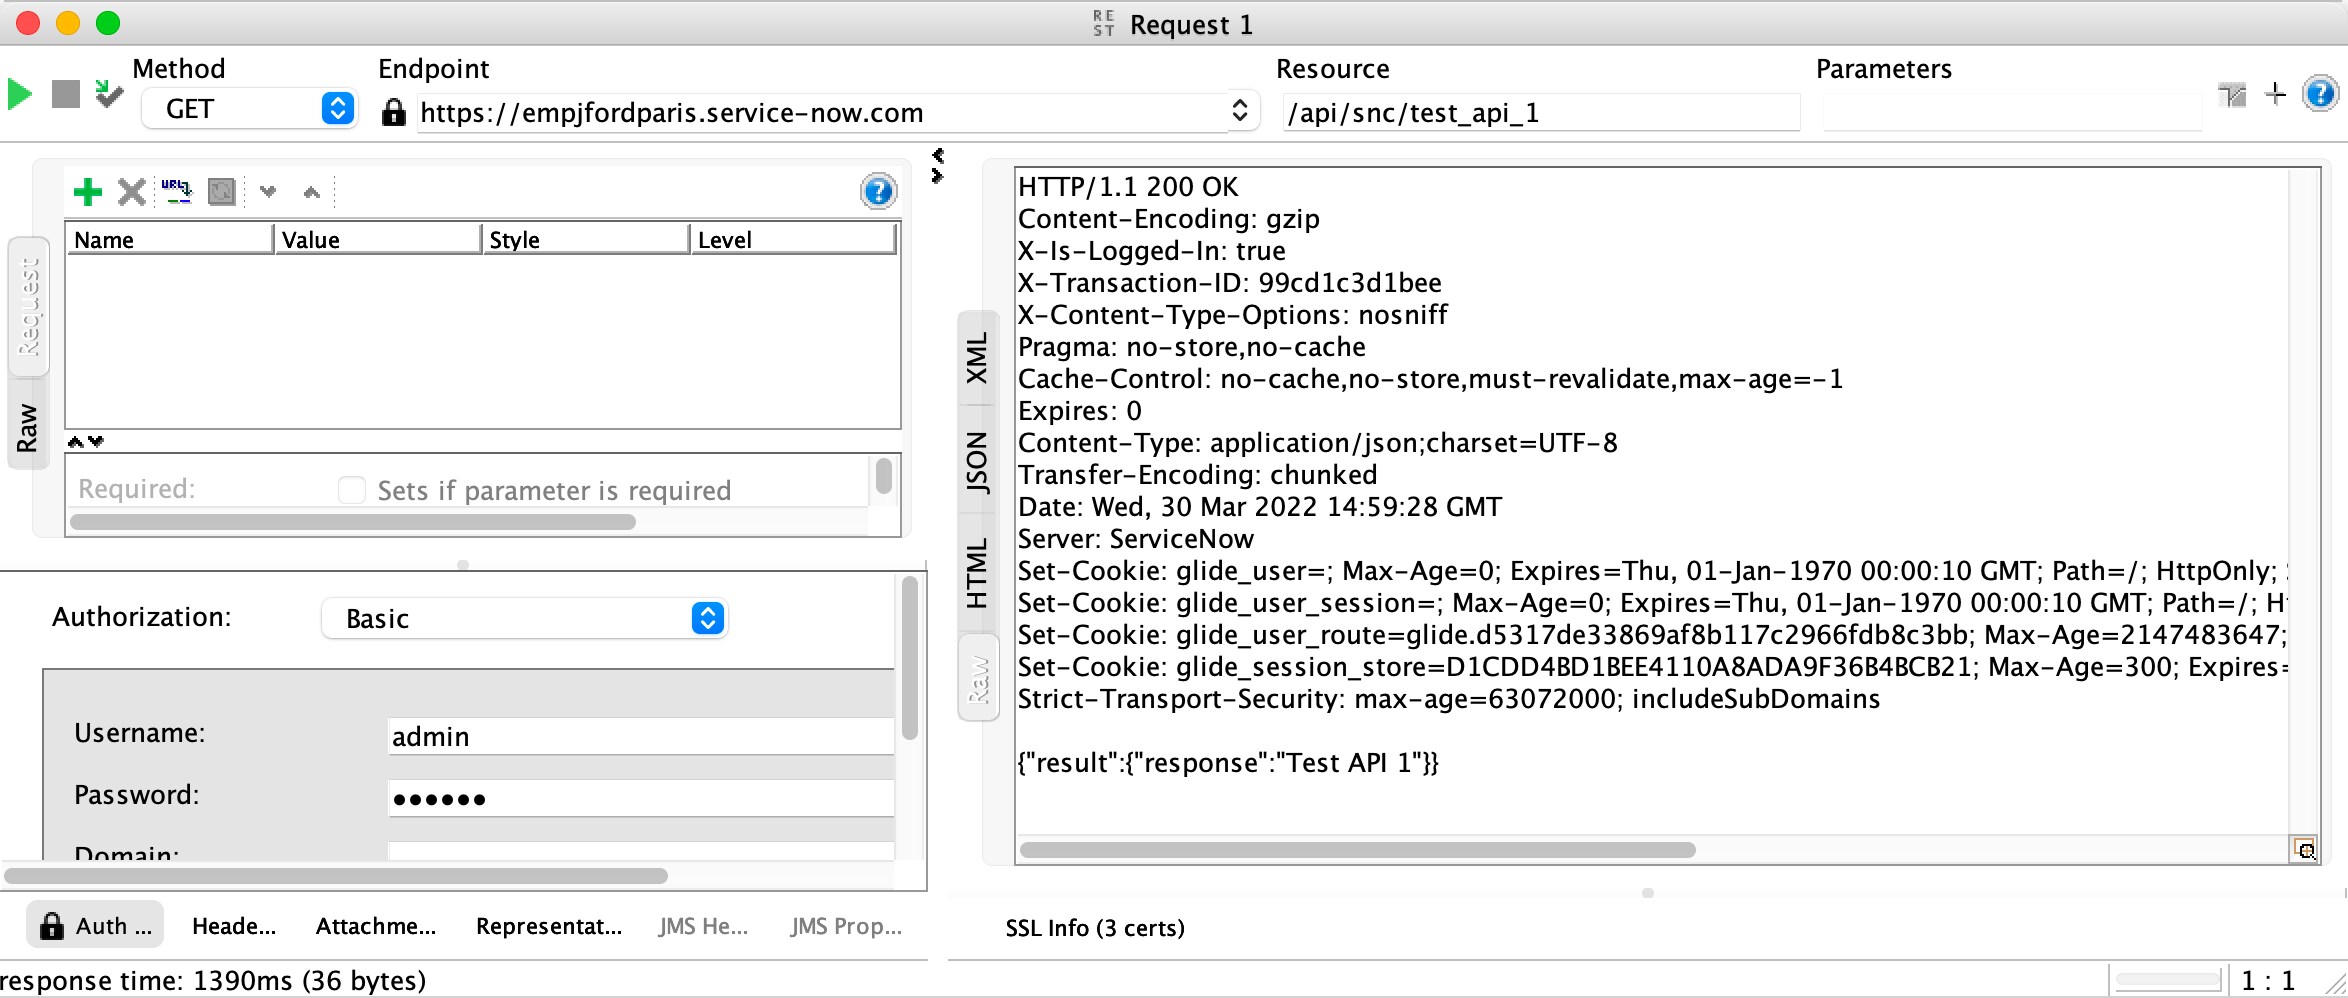
To explain further lets look at a couple of really simple examples. To demonstrate this functionality a series of scripted REST endpoints were created within an instance - these don't do anything apart from sleep for 250ms (to simulate some server side delay whilst processing) then return the name of the corresponding API - for example:

These can be tested your tool of choice (in this case SOAP UI) to ensure that they work as expected - note that the expected response is returned at the bottom on the right, i.e.:

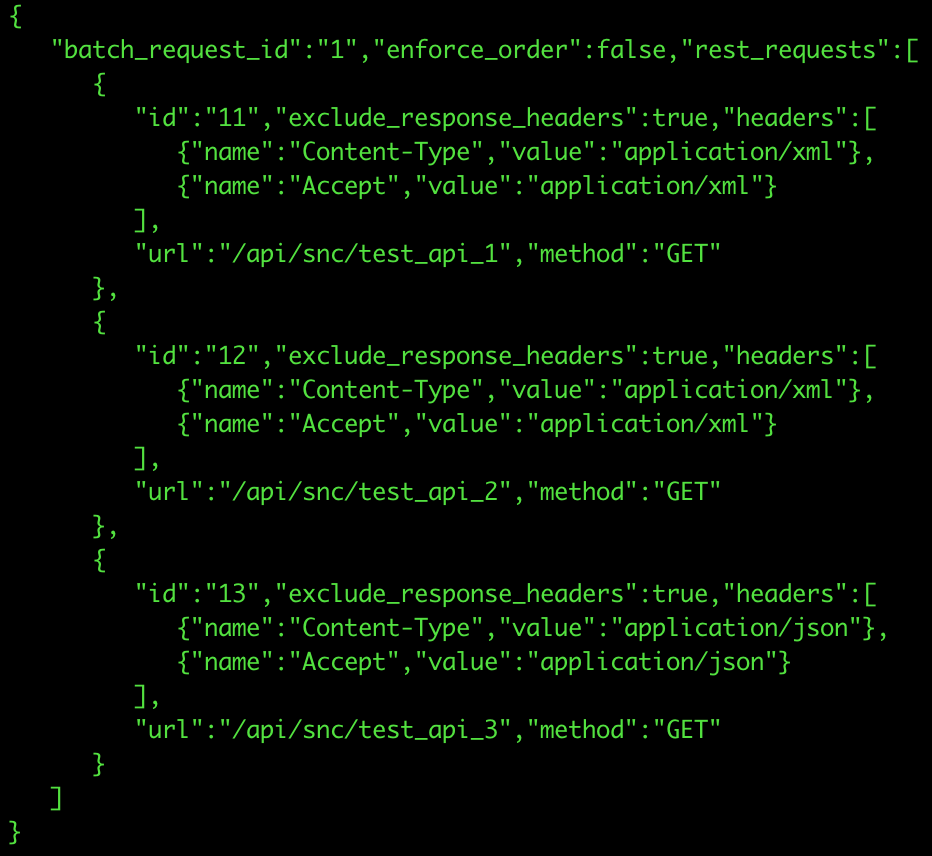
At this point, however, the batch REST API isn't actually being used - instead the API calls are still hitting a 'traditional' REST endpoint (/api/snc/test_api_1). Lets say, however, that there is a requirement to hit 3 APIs in short succession (/api/snc/test_api_1, /api/snc/test_api_2, /api/snc/test_api_3) - here batch REST might make more sense. To leverage batch REST the first step is to create the JSON payload - in this case we:
- Want to perform simple GET requests against each of the endpoints
- Want the response from the first two endpoints to be in an XML format whereas the response to the third endpoint should be in JSON format
The resulting payload reads as follows:
{
"batch_request_id":"1","enforce_order":false,"rest_requests":[
{
"id":"11","exclude_response_headers":true,"headers":[
{"name":"Content-Type","value":"application/xml"},
{"name":"Accept","value":"application/xml"}
],
"url":"/api/snc/test_api_1","method":"GET"
},
{
"id":"12","exclude_response_headers":true,"headers":[
{"name":"Content-Type","value":"application/xml"},
{"name":"Accept","value":"application/xml"}
],
"url":"/api/snc/test_api_2","method":"GET"
},
{
"id":"13","exclude_response_headers":true,"headers":[
{"name":"Content-Type","value":"application/json"},
{"name":"Accept","value":"application/json"}
],
"url":"/api/snc/test_api_3","method":"GET"
}
]
}
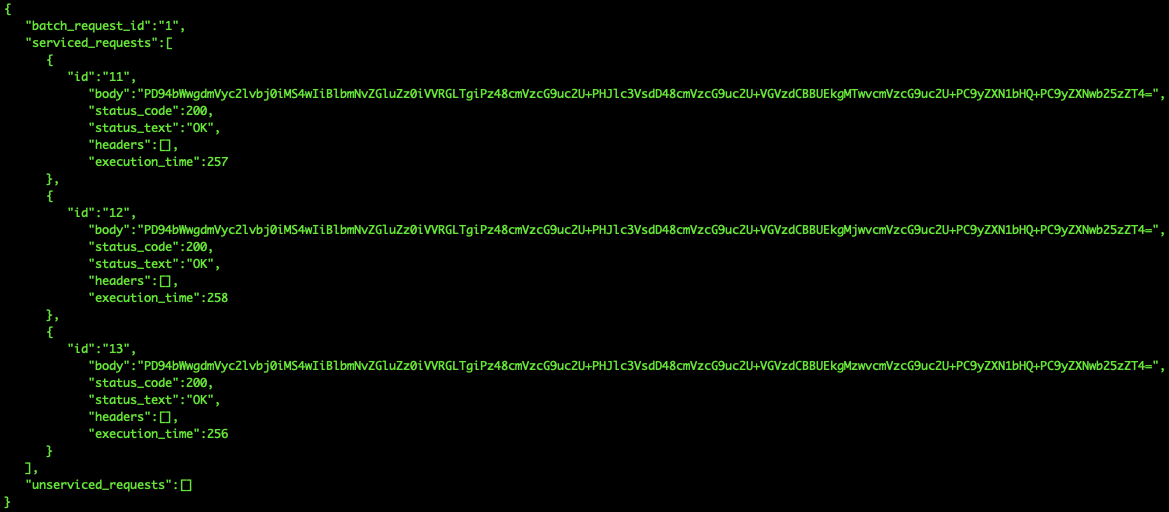
Using SOAP UI this payload is sent in the body of a POST request to the /api/now/v1/batch endpoint. The response (again formatted nicely) is as follows:
{
"batch_request_id": "1",
"serviced_requests":[
{
"id": "11",
"body": "PD94bWwgdmVyc2lvbj0iMS4wIiBlbmNvZGluZz0iVVRGLTgiPz48cmVzcG9uc2U+PHJlc3VsdD48cmVzcG9uc2U+VGVzdCBBUEkgMTwvcmVzcG9uc2U+PC9yZXN1bHQ+PC9yZXNwb25zZT4=",
"status_code": 200,
"status_text": "OK",
"headers": [],
"execution_time": 259
},
{
"id": "12",
"body": "PD94bWwgdmVyc2lvbj0iMS4wIiBlbmNvZGluZz0iVVRGLTgiPz48cmVzcG9uc2U+PHJlc3VsdD48cmVzcG9uc2U+VGVzdCBBUEkgMjwvcmVzcG9uc2U+PC9yZXN1bHQ+PC9yZXNwb25zZT4=",
"status_code": 200,
"status_text": "OK",
"headers": [],
"execution_time": 252
},
{
"id": "13",
"body": "eyJyZXN1bHQiOnsicmVzcG9uc2UiOiJUZXN0IEFQSSAzIn19",
"status_code": 200,
"status_text": "OK",
"headers": [],
"execution_time": 253
}
],
"unserviced_requests": []
}
But what does this tell us:
- Initially there is a section named 'serviced_requests' - this describes API calls which the instance actually attempted to executed - in this case:
- There is a separate section of output for each of my individual API calls
- All of these have status code of 200 (OK) and executed in just over 250ms (due to the 250ms delay added to each of the scripted REST endpoints)
- All of these returned some kind of 'body' - note that this is base64 encoded
- None of these returned any headers
- Next there is a section named 'unserviced_requests' - this would describe API calls which could not be executed by the instance for some reason - in this case this is empty (which is good)
In terms of the actual responses from individual API calls we can simply take the base64 'body' from each and decode, i.e.:
% echo "PD94bWwgdmVyc2lvbj0iMS4wIiBlbmNvZGluZz0iVVRGLTgiPz48cmVzcG9uc2U+PHJlc3VsdD48cmVzcG9uc2U+VGVzdCBBUEkgMTwvcmVzcG9uc2U+PC9yZXN1bHQ+PC9yZXNwb25zZT4=" | base64 -D
<?xml version="1.0" encoding="UTF-8"?><response><result><response>Test API 1</response></result></response>
% echo "PD94bWwgdmVyc2lvbj0iMS4wIiBlbmNvZGluZz0iVVRGLTgiPz48cmVzcG9uc2U+PHJlc3VsdD48cmVzcG9uc2U+VGVzdCBBUEkgMjwvcmVzcG9uc2U+PC9yZXN1bHQ+PC9yZXNwb25zZT4=" | base64 -D
<?xml version="1.0" encoding="UTF-8"?><response><result><response>Test API 2</response></result></response>
% echo "eyJyZXN1bHQiOnsicmVzcG9uc2UiOiJUZXN0IEFQSSAzIn19" | base64 -D
{"result":{"response":"Test API 3"}}
Remember that the payload sent to the batch endpoint specified that the first two responses should be in XML whereas the third response should be in JSON - this explains why the format of the responses changes. That being said we can see that the responses are as we expected.
In addition to GETs the batch REST API also supports the POST method. When POST is used it expects the 'data' being sent to each API call to be included in the body of that API call. With batch REST we therefore:
- Create a JSON / XML body for each API call
- Base64 encode the above JSON / XML body
- Include the encoded body in the batch API JSON payload
- Send this to the /api/now/v1/batch endpoint in the exact same way as shown above
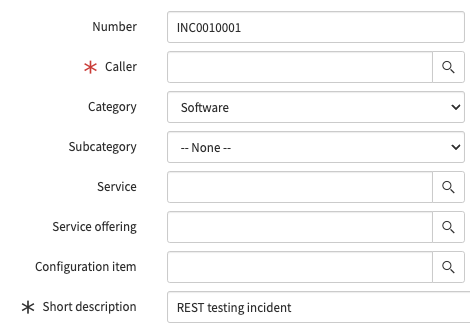
For example lets consider we want to use the incident table API to create a new incident record - first we create the body for the incident table API call specifying values for fields in the record we want to create:
% echo "{\"short_description\":\"Batch REST test incident\",\"category\":\"software\",\"cmdb_ci\":\"b4fd7c8437201000deeabfc8bcbe5dc1\"}" | base64
eyJzaG9ydF9kZXNjcmlwdGlvbiI6IkJhdGNoIFJFU1QgdGVzdCBpbmNpZGVudCIsImNhdGVnb3J5Ijoic29mdHdhcmUiLCJjbWRiX2NpIjoiYjRmZDdjODQzNzIwMTAwMGRlZWFiZmM4YmNiZTVkYzEifQo=
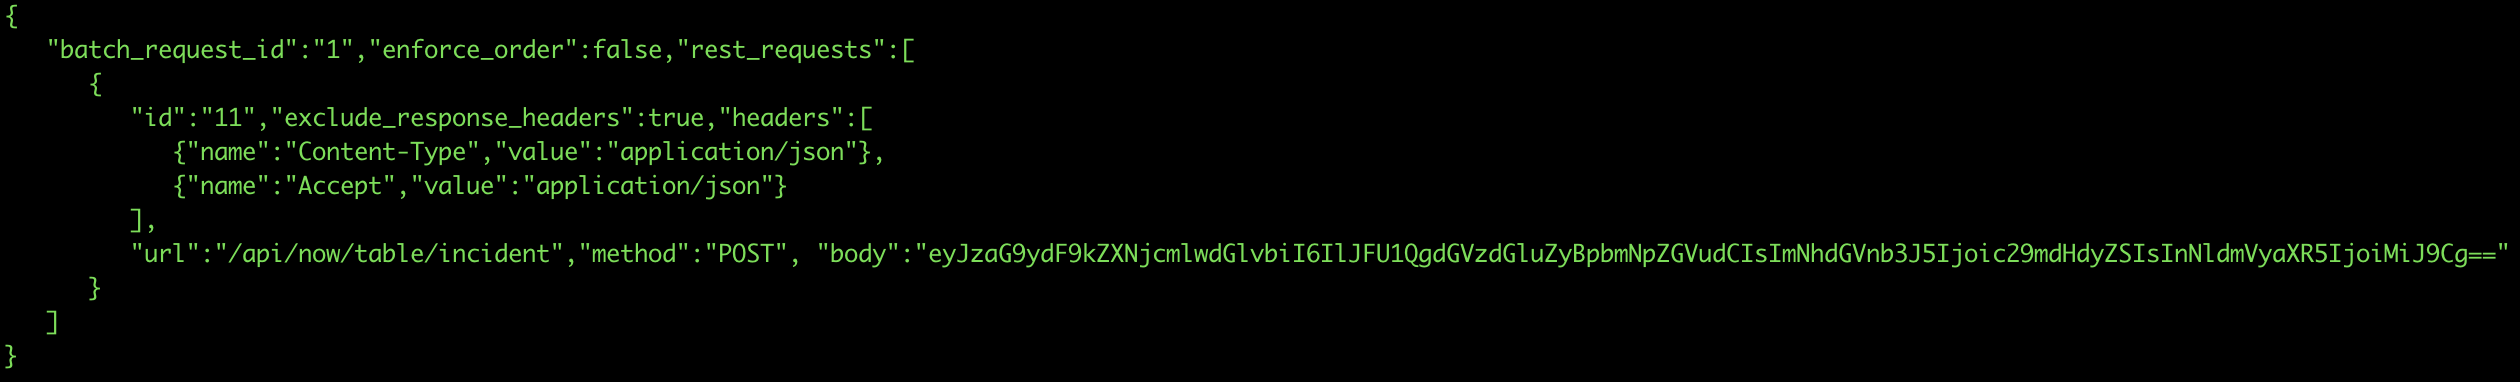
Then we create the batch API payload specifying the POST method against the /api/now/table/incident endpoint with the above as the body for the API call:
{
"batch_request_id":"1","enforce_order":false,"rest_requests":[
{
"id":"11","exclude_response_headers":true,"headers":[
{"name":"Content-Type","value":"application/json"},
{"name":"Accept","value":"application/json"}
],
"url":"/api/now/table/incident","method":"POST","body":"eyJzaG9ydF9kZXNjcmlwdGlvbiI6IkJhdGNoIFJFU1QgdGVzdCBpbmNpZGVudCIsImNhdGVnb3J5Ijoic29mdHdhcmUiLCJjbWRiX2NpIjoiYjRmZDdjODQzNzIwMTAwMGRlZWFiZmM4YmNiZTVkYzEifQo="
}
]
}
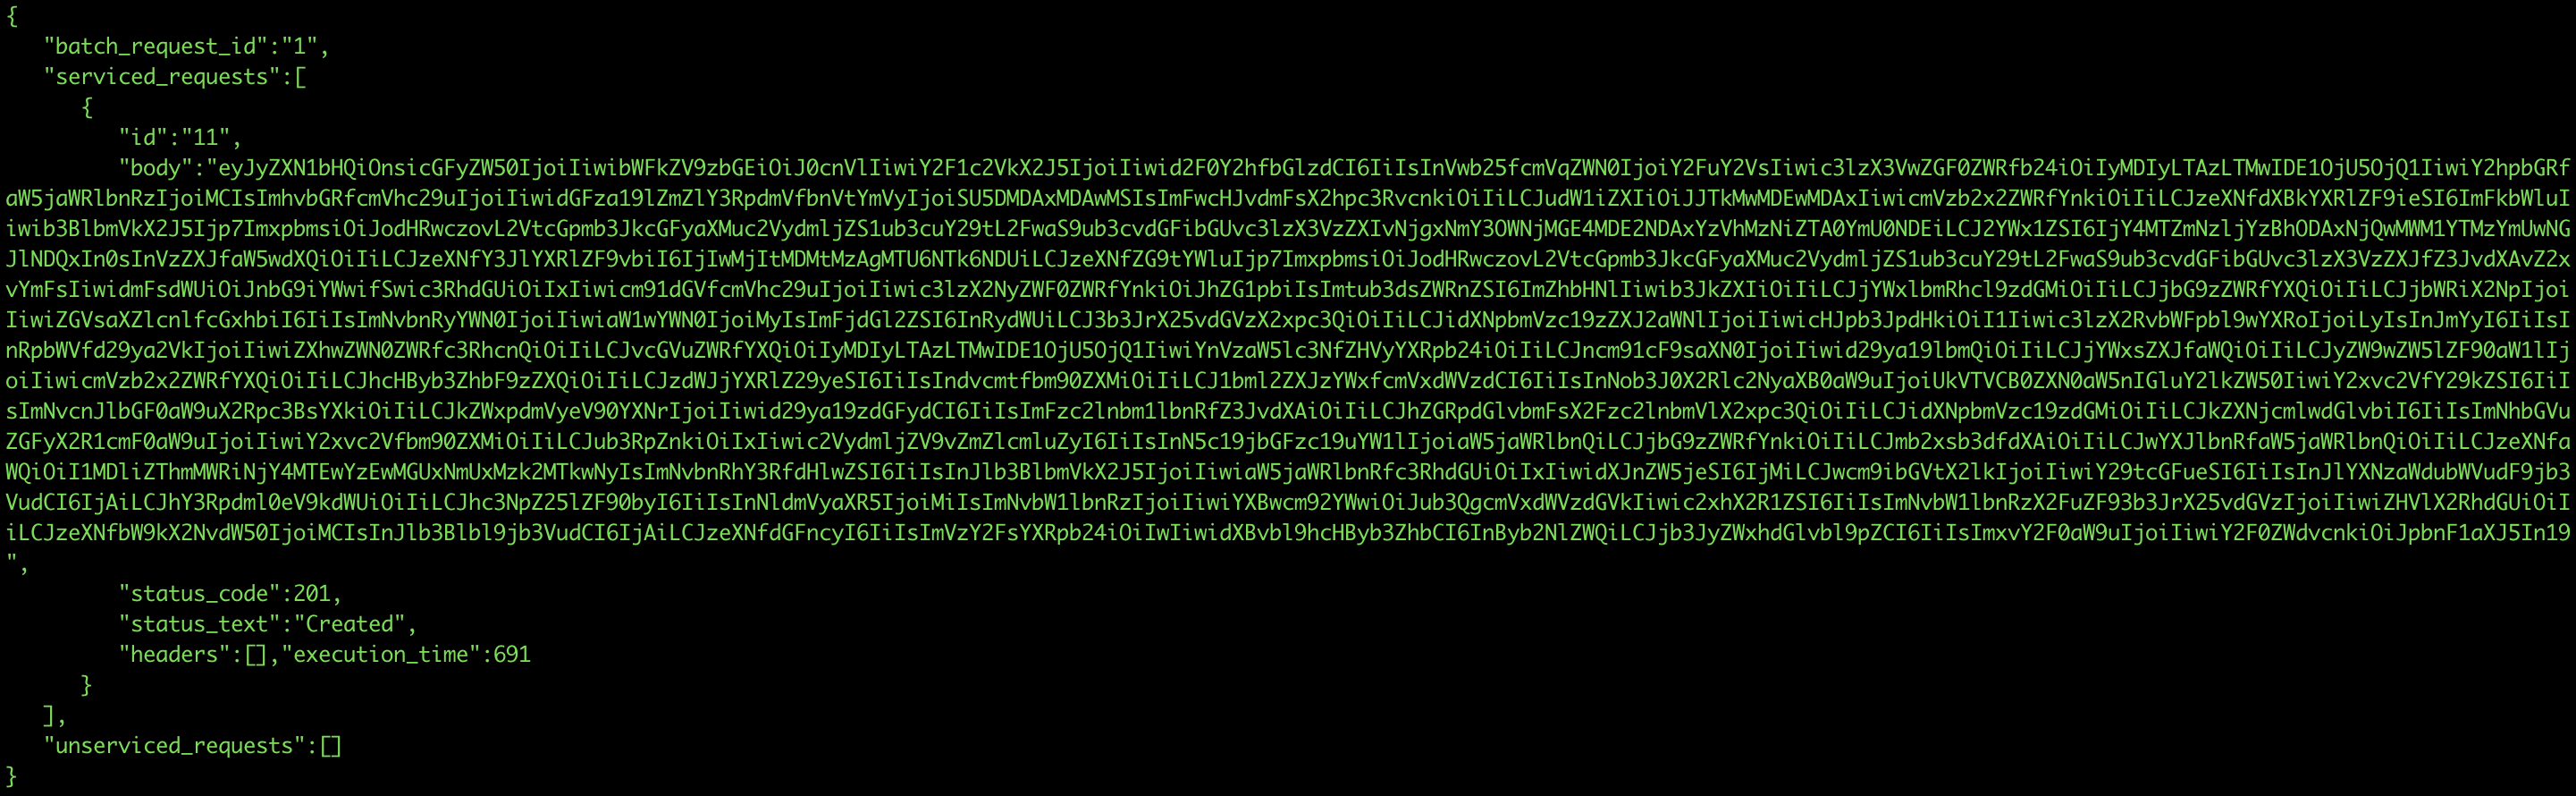
When this is executed a response is returned with status code 201 (Created) - note that the body has been removed for readability:
{
"batch_request_id": "1",
"serviced_requests": [
{
"id": "11",
"body": ...,
"status_code": 201,
"status_text": "Created",
"headers": [],
"execution_time": 260
}
],
"unserviced_requests": []
}
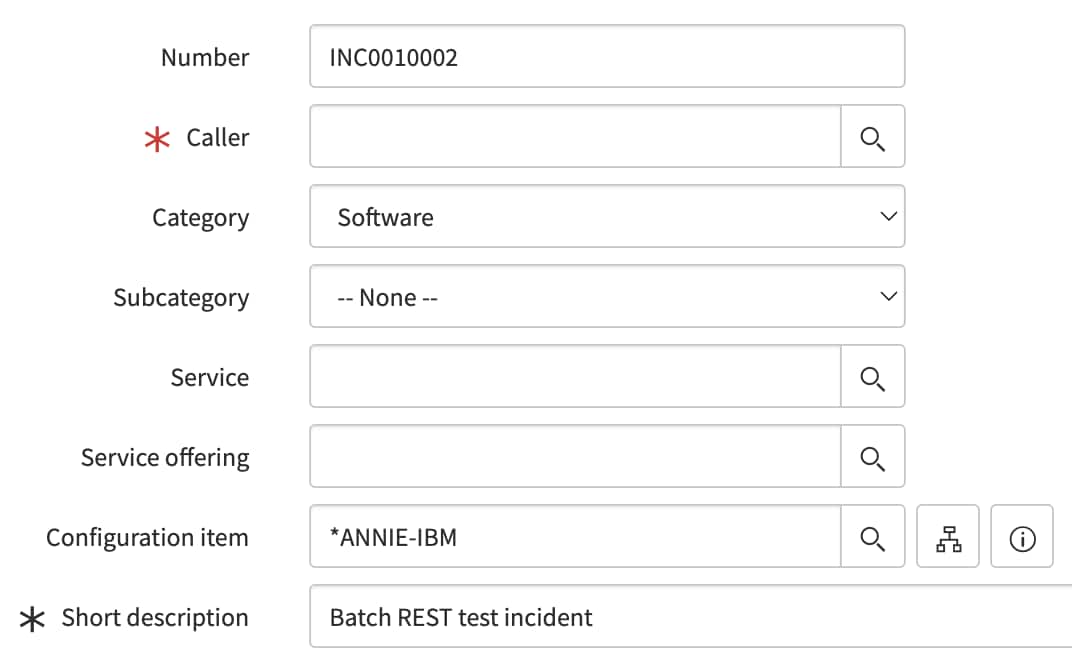
Finally if we check the instance we can see that the incident record has been created as expected:

Improvements when using batch REST API
Now that we understand how the batch REST API is used lets talk about the benefits it can bring. At the top of this article we mentioned that by using the batch REST API its possible to reduce the overhead of network round trips, authentication, and so on but how can we quantify this?
Using a ServiceNow instance and SOAP UI we can set up some simple test cases - for example:
- Within the instance create 20 scripted REST API endpoints - each of these simply sleeps for 250ms (to simulate server side delay) then returns a string
- In SOAP UI set up four different test cases:
- Execute calls to each of the 20 scripted REST API endpoints individually
- Execute calls to the batch REST API endpoint where each call hits 5 of the scripted REST endpoints
- Execute calls to the batch REST API endpoint where each call hits 10 of the scripted REST endpoints
- Execute calls to the batch REST API endpoint where each call hits all 20 of the scripted REST endpoints
- Again in SOAP UI configure each test case to:
- Run with 8 threads (i.e. have the ability to make 8 API calls simultaneously) - this is because the ServiceNow instance has 2 application nodes with each node having 4 integrations semaphores / threads so by making up to 8 API calls simultaneously SOAP UI will not see any of its transactions queued on application nodes
- Run for a duration of 5 minutes
- Not involve any delays between completing an API call and triggering the next API call (i.e. run as fast as possible)
- Close the connection once each API calls completes
- Stop the test after exactly 5 minutes (instead of allowing 'in flight' API calls to complete)
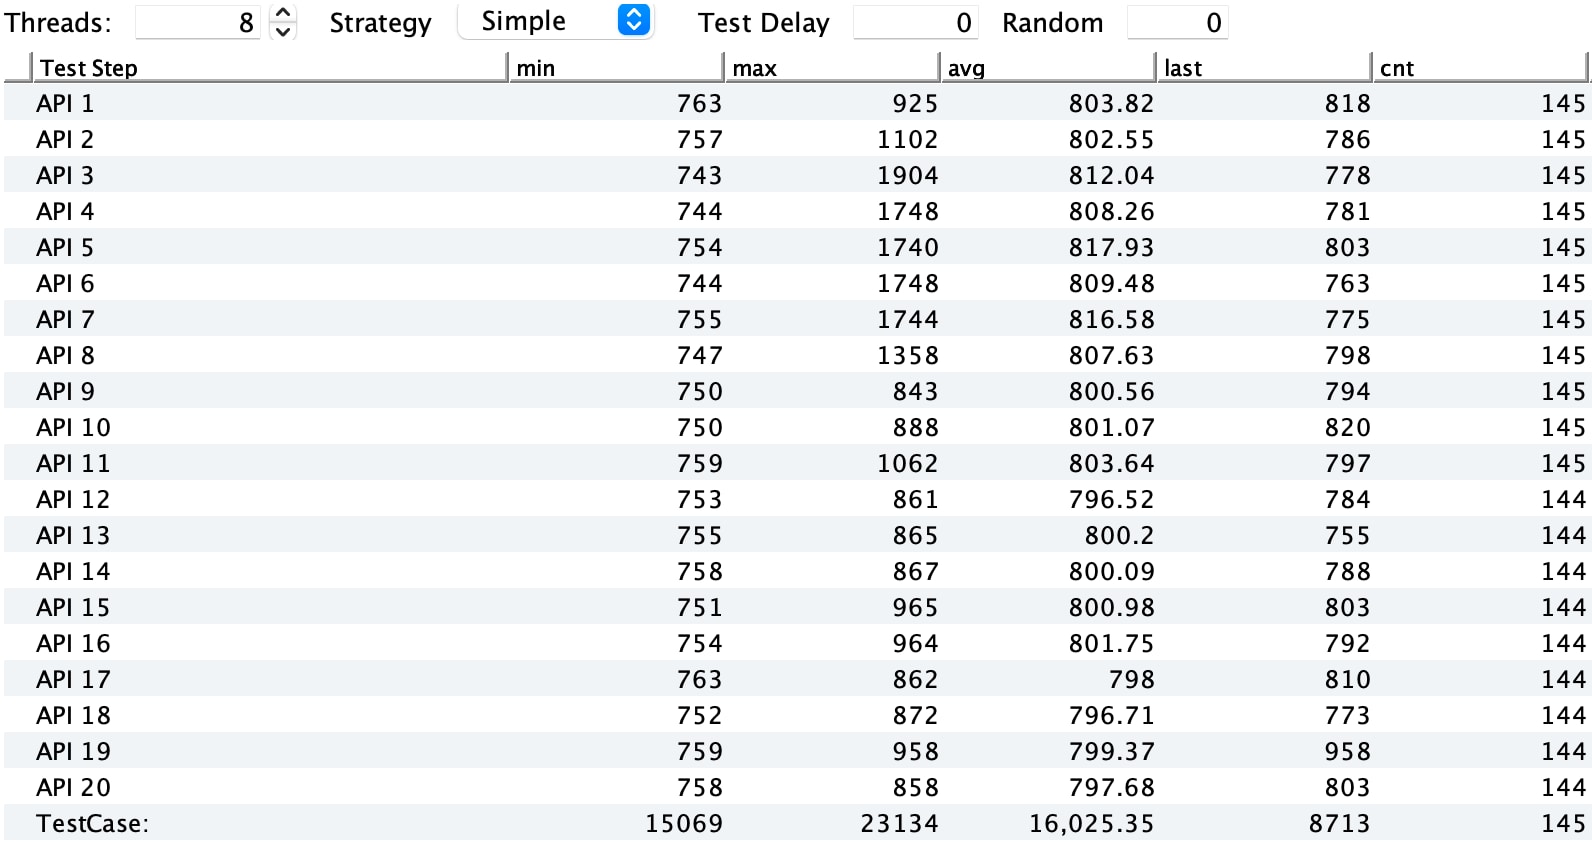
Each test case provides output similar to the following (this is taken from the test case hitting each of the scripted REST API endpoints individually):

This indicates that:
- The test was able to hit 2891 scripted REST API endpoints within 5 minutes using 8 threads
- Each call to a scripted REST API endpoint therefore took an average of ((300 / 2891) * 😎 830.163ms to complete
Now lest compare results from each of the test cases:
- No batching (i.e. the test case shown above)
-
- Total number of scripted REST API endpoints hit in 5 minutes: 2891
- Average duration for each call to a scripted REST API endpoint to complete: 830.163ms
- Batching API calls in groups of 5
-
- Total number of scripted REST API endpoints hit in 5 minutes: 6565
- Average duration for each call to a scripted REST API endpoint to complete: 365.575ms
- Improvement per call to scripted REST API endpoint when compared to no batching: ~56%
- Batching API calls in groups of 10
-
- Total number of scripted REST API endpoints hit in 5 minutes: 7690
- Average duration for each call to a scripted REST API endpoint to complete: 312.094ms
- Improvement per call to scripted REST API endpoint when compared to no batching: ~62%
- Batching API calls in groups of 20
-
- Total number of scripted REST API endpoints hit in 5 minutes: 8500
- Average duration for each call to a scripted REST API endpoint to complete: 282.353ms
- Improvement per call to scripted REST API endpoint when compared to no batching: ~66%
These tests are hugely synthetic and ultimate performance depends on many variables however we can see that from going to individual calls to scripted REST API endpoints to batching calls in groups of 5 (which is much more reasonable in the real world than batching everything) we achieved an approximate 56% improvement in performance / throughput!
Are There Any Other Benefits From Batching API Requests
Yes! To illustrate this we can refer to a real issue seen within a customer implementation:
- A large ServiceNow customer was releasing a new in person 'experience' to their employees
- They wanted their employees to book appointments at the 'experience' using the ServiceNow platform
- To make bookings employees would visit a custom UI page within the platform - this page made multiple REST API calls back to the instance to populate data (the average number of REST API calls was around 20 per page load)
- The customer planned to send the URL for the UI page to their employees at a certain date / time after which there would be a 'free for all' whilst employees attempted to book appointments on a 'first come first served' basis
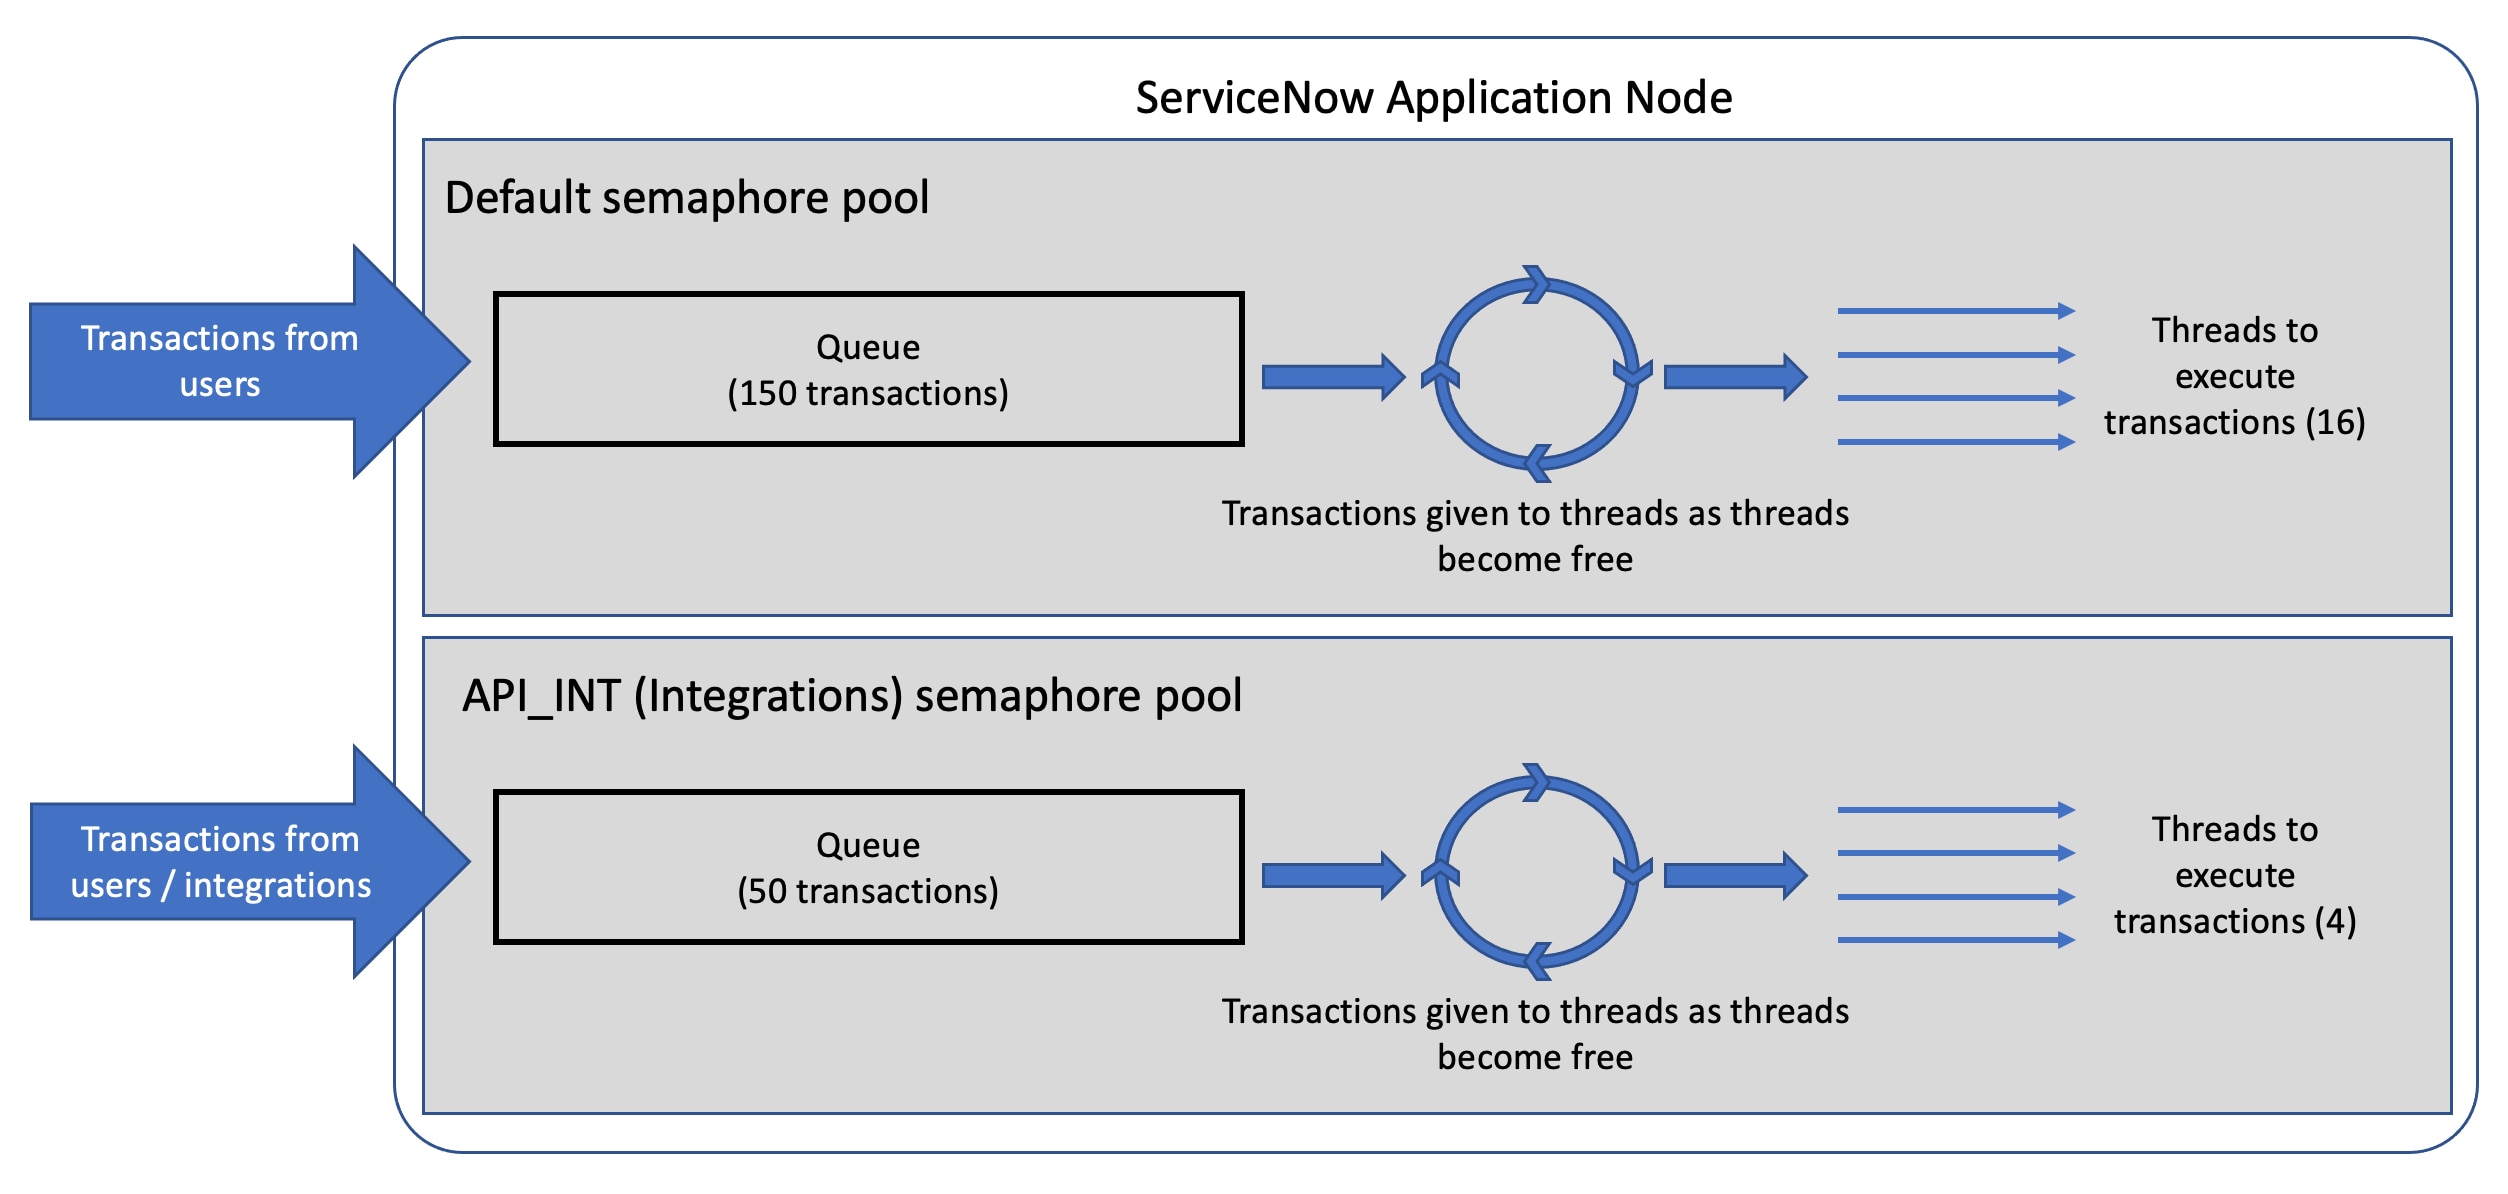
What this meant is that, when the URL was released to employees, there would be a flood of activity against the instance as employees hit the UI page. Due to the number of REST API calls generated per UI page load, however, there would be a tsunami of REST API calls hitting the instance. As you can probably guess this didn't scale well - but to understand why we need to look at how application nodes process transactions:

In addition to the above note that:
- A single user (more specifically a single user session) can only execute one transaction at one (i.e. a users transactions are serialised)
- If a semaphore pool queue completely fills with 'buffered' transactions any new transactions for that pool arriving at the application node will be rejected (and will not run)
- A single user (again actually a single user session) can only 'buffer' a maximum of 10 transactions in a semaphore queue
- Most of the parameters (i.e. number of threads per pool, size of semaphore pool queue, number of transactions a sessions can queue) are configurable - the diagram above simply shows the out of box defaults
- The diagram is a very high level overview (the reality is far more complex than this and there are many more semaphore pools with different uses than shown)
As per usual this customer started with the default application node configuration. When they tested their implementation (thankfully long before 'go live') they immediately saw issues:
- A user would hit the UI page (no issue here as the corresponding transaction was executed within the default semaphore pool)
- When the page rendered in their browser, however, it kicked off an average of 20 REST API calls which hit an application node in short succession
- The application node would:
-
- Start to execute the transaction relating to the first REST API call
- Queue transactions for an additional 10 REST API calls
- Reject any remaining REST API calls (so that these wouldn't be run at all)
Given that a large proportion of transactions were being rejected the UI page essentially didn't work. To counter this they changed system properties to allow a single user session to be able to queue more transactions (lets say 20 total instead of the default of 10). They then tested again:
- This time a single user hitting the UI page worked fine
- As soon as they had a handful of users hitting the page in parallel, however, the API_INT semaphore pool would quickly 'buffer' transactions in all of its 50 slots (i.e. it would become full)
- Users would start to see random REST API calls being rejected (so the page was basically broken again)
Again to counter this the customer changed system properties some more to allow the API_INT semaphore pool to queue 1000 transactions. At this point testing kind of worked OK however:
- The configuration of the instance had been very specifically tailored to this single use case
- Buffering transactions takes memory (so they were at increased risk of memory contention on their application nodes which can cause all kinds of performance issues)
- The customer was some way away from the default / best practice application node configuration so were at risk of all kinds of other 'unexpected' issue just due to running in such a 'niche' way
Basically we (ServiceNow) weren't particularly happy with the situation and it turned out that using batch API requests was the magic bullet to put things right. In summary we worked together to batch REST API requests (generally sending 5 individual API calls to the application node in one transaction to the /api/now/batch endpoint). This resulted in:
- An immediate 75% reduction in REST related transactions triggered by users hitting the custom UI page
- Far less transactions being placed in semaphore pool queues (and therefore much less chance of an individual queue filling and transactions being rejected)
- Individual users having to 'buffer' a much smaller number of transactions in a semaphore pool queue and therefore less likelihood that a single user would need to queue more than 10 transactions and see transactions rejected
This is in addition to the performance benefits (which we've already discussed) effectively meant that the throughput of REST API calls was much improved placing application nodes under less stress and giving a significantly improved end user experience. Ultimately the customer went live with this solution and despite ServiceNow (and the customer) being on a heightened level of sensitivity for things going wrong the implementation performed well with no hitches.
Is There Anything Else Of Note Around Batched API Requests?
Yes - there are three important things to be aware of when using batched API requests:
- Only batch REST API calls which aren't dependent on each other
- Its relatively common when using multiple REST API calls that you execute the first call then only execute the second or maybe third calls depending on the response from the first call (i.e. some of your REST API calls are conditional)
- Likewise you might have a scenario where you use part of the response from the first REST API call as input to (for example in the body of) the second REST API call
- In these scenarios its not really possible to batch as the batch API endpoint doesn't give you the possibility to perform server side processing of output from one call then conditionally execute or modify the parameters of a later call
- Batching only works well where you have a set of REST API calls which you know you need to run in a given scenario and there is no dependency between them
- Logging changes quite significantly
- The ServiceNow instance uses the syslog_transaction table to store metrics around the performance of individual transactions
- If you are using individual REST API calls to specific endpoints then you will see a transaction in this table relating to this endpoint - for example below we can see a transaction which hit /api/snc/test_api_10:

- This is helpful as we know metrics associated with the above transaction are specific to a single REST API call to the given endpoint (which will perform a well defined operation)
- Once, however, you start using batch REST API requests you will no longer see syslog_transaction records relating to an individual endpoint - instead you will just see a record against the batch endpoint which might have actually executed an arbitrary number of individual REST API calls, i.e.:

- The problem this causes is that if one of the individual REST API calls executed via the batch then the entire batch will be slow however you will have no visibility into which of the individual calls is slow
- To work this out you are forced to review application node logs - here the transaction logs messages indicating when it starts each individual REST API call so you can see details in a much more granular fashion (along with any informational or debug messages printed by your REST API endpoint). For example if we look at the application node log relating to the above transaction we see the following and can now work out exactly how long each of the constituent / individual API calls took:
2022-03-31 05:06:37 (999) Default-thread-115 C3CFBCCA1B2E8110A8ADA9F36B4BCB2F txid=0bcfbcca1b2e Bypassing ACL checks for a public page: /api/now/v1/batch
2022-03-31 05:06:37 (999) Default-thread-115 C3CFBCCA1B2E8110A8ADA9F36B4BCB2F txid=0bcfbcca1b2e #18834 /api/now/v1/batch Parameters -------------------------
api=api
2022-03-31 05:06:37 (999) Default-thread-115 C3CFBCCA1B2E8110A8ADA9F36B4BCB2F txid=0bcfbcca1b2e *** Start #18834 /api/now/v1/batch, user: admin
2022-03-31 05:06:38 (000) Default-thread-115 C3CFBCCA1B2E8110A8ADA9F36B4BCB2F txid=0bcfbcca1b2e #18834 [REST API] BatchItemExecutor : *** Start batch item /api/snc/test_api_11 with id=10
2022-03-31 05:06:38 (256) Default-thread-115 C3CFBCCA1B2E8110A8ADA9F36B4BCB2F txid=0bcfbcca1b2e #18834 [REST API] BatchItemExecutor : *** End batch item /api/snc/test_api_11 with id=10
2022-03-31 05:06:38 (256) Default-thread-115 C3CFBCCA1B2E8110A8ADA9F36B4BCB2F txid=0bcfbcca1b2e #18834 [REST API] BatchItemExecutor : *** Start batch item /api/snc/test_api_12 with id=11
2022-03-31 05:06:38 (508) Default-thread-115 C3CFBCCA1B2E8110A8ADA9F36B4BCB2F txid=0bcfbcca1b2e #18834 [REST API] BatchItemExecutor : *** End batch item /api/snc/test_api_12 with id=11
2022-03-31 05:06:38 (509) Default-thread-115 C3CFBCCA1B2E8110A8ADA9F36B4BCB2F txid=0bcfbcca1b2e #18834 [REST API] BatchItemExecutor : *** Start batch item /api/snc/test_api_13 with id=12
2022-03-31 05:06:38 (761) Default-thread-115 C3CFBCCA1B2E8110A8ADA9F36B4BCB2F txid=0bcfbcca1b2e #18834 [REST API] BatchItemExecutor : *** End batch item /api/snc/test_api_13 with id=12
2022-03-31 05:06:38 (761) Default-thread-115 C3CFBCCA1B2E8110A8ADA9F36B4BCB2F txid=0bcfbcca1b2e #18834 [REST API] BatchItemExecutor : *** Start batch item /api/snc/test_api_14 with id=13
2022-03-31 05:06:39 (014) Default-thread-115 C3CFBCCA1B2E8110A8ADA9F36B4BCB2F txid=0bcfbcca1b2e #18834 [REST API] BatchItemExecutor : *** End batch item /api/snc/test_api_14 with id=13
...
2022-03-31 05:06:43 (108) Default-thread-115 C3CFBCCA1B2E8110A8ADA9F36B4BCB2F txid=0bcfbcca1b2e tx_pattern_hash=-1546795976 EXCESSIVE *** End #18834 /api/now/v1/batch, user: admin, total time: 0:00:05.116, processing time: 0:00:05.116, SQL time: 0:00:00.022 (count: 32), ACL time: 0:00:00.004, source: 199.91.137.61 , type:batch_rest, method:POST, api_name:now/batch, resource:now/v1/batch, user_id:6816f79cc0a8016401c5a33be04be441, response_status:200
- This isn't an issue, per se, however it might cause you to change how you approach or perform some additional steps when investigating performance concerns
- Transactions are executed by a different set of threads
- Normal REST API calls to a specific endpoint (such as /api/snc/test_11_api) will hit the API_INT (Integrations) semaphore pool and will therefore leverage that pools queue (which can hold 50 transactions) and execute on one of its 4 threads
2022-03-31 05:12:51 (585) API_INT-thread-2 123189CE1B2E8110A8ADA9F36B4BCB04 txid=563189ce1b2e *** Start #20260 /api/snc/test_api_11, user: admin
- Batch REST API calls, however, do not share this behaviour - instead they hit the default semaphore pool and therefore a queue which can hold 150 transaction and has 16 threads
2022-03-31 05:06:37 (999) Default-thread-115 C3CFBCCA1B2E8110A8ADA9F36B4BCB2F txid=0bcfbcca1b2e *** Start #18834 /api/now/v1/batch, user: admin
- As discussed previously the default semaphore pool commonly has far more resources (i.e. 16 threads) than the API_INT semaphore pool (4 threads) so in many cases this can be a good thing
- In other cases, however, this can be an issue - lets say you have an instance which is extremely busy so your default semaphore pool is often close to the limit in terms of how many transactions is can process. If you suddenly add more workload (by batching REST calls) this might be enough to push it over the edge and cause exhaustion and more widespread issues
- Its possible to change this behaviour such that batch REST API transactions are executed on an API_INT thread (i.e. in the same semaphore pool that transactions relating to the individual REST API calls would be executed) however this change needs to be made by ServiceNow support as it requires editing a record in the sys_semaphore table which is not something customers have access to
- 29,796 Views
- Mark as Read
- Mark as New
- Bookmark
- Permalink
- Report Inappropriate Content
Thanks for sharing this article.
It was very interesting.
- Mark as Read
- Mark as New
- Bookmark
- Permalink
- Report Inappropriate Content
Ahoy, thank you for very informative post, I highly appreciate this kind of content.
Q: Do I understand the semaphore pool correctly; if there is 150 transactions already queued in the pool, the 151st transaction created is basically thrown away and not served?
Does the same apply for 11th transaction of a single session?
(Lets consider OOB limits; 150 per pool and 10 transactions per session)
Thank you
- Mark as Read
- Mark as New
- Bookmark
- Permalink
- Report Inappropriate Content
No problem - I'm glad you found this useful.
Yes - you are pretty much correct. Rather than transactions being 'thrown away' they are rejected (with an HTTP 429 error being returned to the client). In the case of the default semaphore pool, for example, this allows the client to display an error so that the user knows something has gone wrong.
Essentially, however, the rest of what you asked is exactly what happens. The default semaphore pool, for example, can (by default) queue 150 transactions per node - any additional transactions which arrive whilst the queue on a given node is full are rejected and *will not execute*. This persists until space is made in that queue by existing transactions being executed. The exact same happens if a single session attempts to queue more than 10 (by default) transactions.
In normal operations either of the above scenarios is unusual but can occur (and can be made more likely by certain types of application design) but we do log that this has happened. In addition, assuming you have an instance which is hosted in our cloud, the first of these scenarios (a semaphore queue overflowing) will trigger an alert which will then be investigated.
- Mark as Read
- Mark as New
- Bookmark
- Permalink
- Report Inappropriate Content
@GTSPerformance - I am not able to get the response body but getting 200 status code. Can you please suggest.
Regards,
Gayathri Balavenkateshan
- Mark as Read
- Mark as New
- Bookmark
- Permalink
- Report Inappropriate Content
Hi Gayathri,
If you are getting a status code of 200 then I am assuming you are doing something like a GET request. In this case the response body should be a base64 encoded value in the 'body' field of the response. Let me try and illustrate this with a simple example:
First I build my batch API payload:
{
"batch_request_id":"1","enforce_order":false,"rest_requests":[
{
"id":"11","exclude_response_headers":true,"headers":[
{"name":"Content-Type","value":"application/json"},
{"name":"Accept","value":"application/json"}
],
"url":"/api/now/table/incident?sysparm_fields=number%2Cstate&sysparm_limit=1","method":"GET"
}
]
}
From the above we can see that I am executing a single GET request against the incident table using table API (i.e. using a URL of /api/now/table/incident). The parameters in my URL specify that I want to return the number and state fields from the first record matched. In addition I am requesting the response body to be in JSON format.
I then execute this against the /api/now/v1/batch endpoint within my instance and receive a raw response as follows:
HTTP/1.1 200 OK
X-Is-Logged-In: true
X-Transaction-ID: 75beb890db2b
Cache-Control: no-cache,no-store,must-revalidate,max-age=-1
Expires: 0
Pragma: no-store,no-cache
Content-Type: application/json
Transfer-Encoding: chunked
Date: Tue, 29 Nov 2022 14:46:28 GMT
Server: ServiceNow
Set-Cookie: JSESSIONID=C7478DF3DD31D228FAC56CAFC03EC28F; Path=/; HttpOnly; SameSite=None; Secure
Set-Cookie: glide_user=; Max-Age=0; Expires=Thu, 01-Jan-1970 00:00:10 GMT; Path=/; HttpOnly; SameSite=None; Secure
Set-Cookie: glide_user_session=; Max-Age=0; Expires=Thu, 01-Jan-1970 00:00:10 GMT; Path=/; HttpOnly; SameSite=None; Secure
Set-Cookie: glide_user_route=glide.dd923e003ca0b1959c284abb04914fb4; Max-Age=2147483647; Expires=Sun, 17-Dec-2090 18:00:35 GMT; Path=/; HttpOnly; SameSite=None; Secure
Set-Cookie: glide_session_store=31BEB890DB2BDD10899A3EC3E2961943; Max-Age=1800; Expires=Tue, 29-Nov-2022 15:16:28 GMT; Path=/; HttpOnly; SameSite=None; Secure
Set-Cookie: BIGipServerpool_xxx=210392842.54078.0000; path=/; Httponly; Secure; SameSite=None; Secure
Strict-Transport-Security: max-age=63072000; includeSubDomains
{"batch_request_id":"1","serviced_requests":[{"id":"11", "body":"eyJyZXN1bHQiOlt7Im51bWJlciI6IklOQzAwMDAwNjAiLCJzdGF0ZSI6IjcifV19","status_code":200,"status_text":"OK","headers":[],"execution_time":254}],"unserviced_requests":[]}
The above shows me that the overall batch API call was successful (as I got an HTTP status of 200). If I print the body in a more readable format its as follows:
{
"batch_request_id": "1",
"serviced_requests": [ {
"id": "11",
"body": "eyJyZXN1bHQiOlt7Im51bWJlciI6IklOQzAwMDAwNjAiLCJzdGF0ZSI6IjcifV19",
"status_code": 200,
"status_text": "OK",
"headers": [],
"execution_time": 254
}],
"unserviced_requests": []
}
As you can see this contains details of the single transaction I included in the payload sent to the batch API endpoint. This single transaction also has status code 200 (so it was successful). If I want to see details of exactly what is returned I can take the value in 'body' and base64 decode:
$ echo "eyJyZXN1bHQiOlt7Im51bWJlciI6IklOQzAwMDAwNjAiLCJzdGF0ZSI6IjcifV19" | base64 -D
{"result":[{"number":"INC0000060","state":"7"}]}
Please let me know if this helps? Ultimately if you think the batch API endpoint is doing something wrong I'd recommend opening a support case so we can assist you further.
Thanks!
- Mark as Read
- Mark as New
- Bookmark
- Permalink
- Report Inappropriate Content
Thank you for this article, magnificent post, it goes to Bookmarks right away!