- Post History
- Subscribe to RSS Feed
- Mark as New
- Mark as Read
- Bookmark
- Subscribe
- Printer Friendly Page
- Report Inappropriate Content
on 12-20-2021 01:37 PM
How do Process Optimization and Performance Analytics complement each other to drive process service excellence?
As organizations are striving for service excellence, they are relying on insight into their processes, services portfolio, and vendor services. When it comes to visibility into process performance, several ServiceNow applications such as Performance Analytics, Process Optimization, Reporting, and Benchmarking play a key role. However, in some cases, organizations are unsure what to expect from these applications, if they overlap or complement each other, and how to deploy them. The best way to help understand the added value of these applications in supporting service excellence is to look at it from a continual improvement viewpoint.
Continual Improvement Management (CIM) Life Cycle
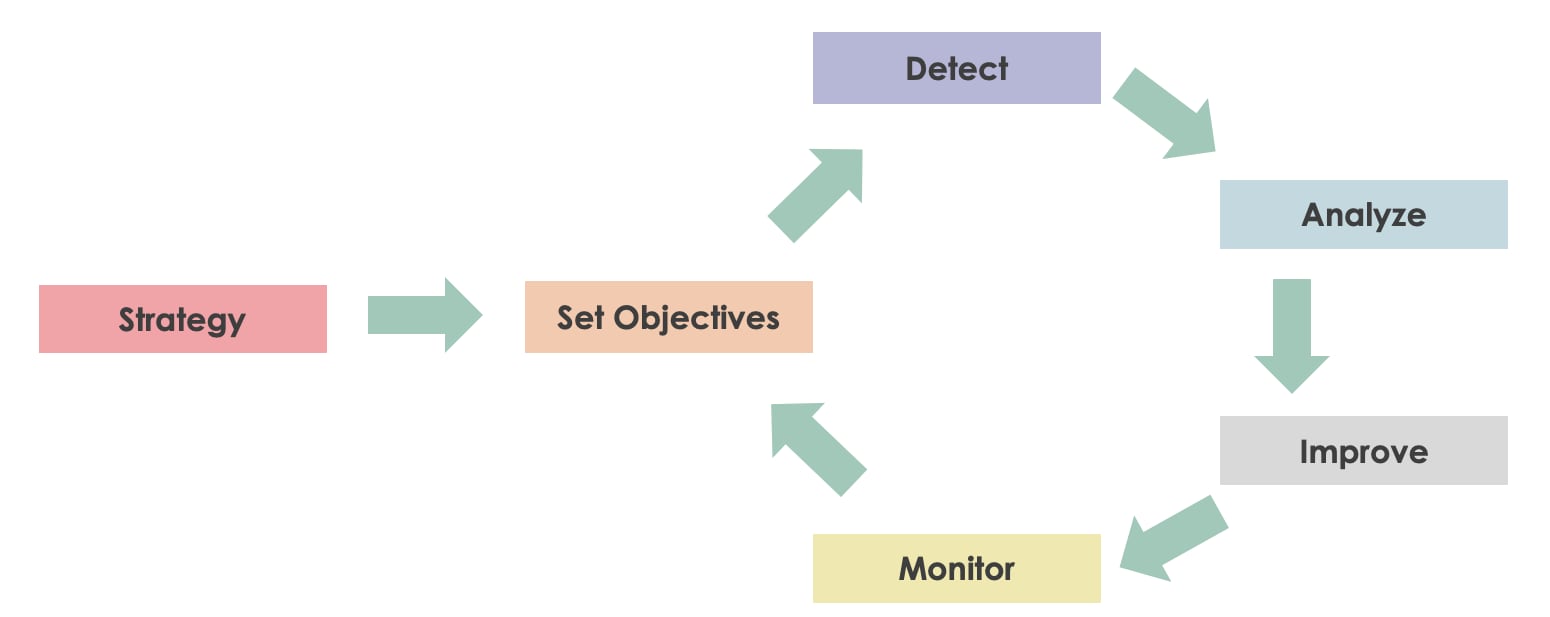
In an effort to continually improve service processes, organizations agree on a set of repetitive actions that resemble the picture below.

Figure 1: Continual Improvement Life Cycle
The extent to which a CIM practice impacts process performance depends on how well CIMs five phases (set objectives, detect, analyze, improve, and monitor) are working collectively.
Set objectives - First, organizations should periodically agree on measurable and achievable business objective KPIs, based on a clear strategy, to help achieve its strategy and assess the performance of the business against these objectives. Example objectives are reduced mean time to resolution (MTTR), increased self-service, and fewer ticket hops.
Detect - This will enable organizations to start detecting improvement opportunities in the context of the objectives. Typically, this is done by finding what went wrong from within a large dataset. Example techniques are trend line analysis, anomaly detection, survey, and Service Level Agreement (SLA) performance monitoring.
Analyze - Then the analysis phase tries to answer why particular KPIs went wrong. Process mining-related capabilities like automated process discovery, conformance checking, and model enhancement are designed to do this job. Process discovery helps to understand the actual state of a particular process by analyzing process log event data. Conformance shows if the actual process deviated from the designed process to detect discrepancies and determine its impact. Finally, with model enhancement, the process model enriches statistical information, enabling root cause and bottleneck analysis.
Improve - As we now know what needs to improve and understand why it went wrong, we want to improve the actual process. Overall, three types of actions can be used to improve:
- Improve process performance through automation.
- Improve team performance, improve onboarding, scheduling, training, etc.
- Redesign the processes, by removing redundant tasks like unnecessary approvals.
Monitor - Finally, when the improvement is in place, monitoring needs to ensure that achieved service improvement stays over a more extended period and that the organization does not fall back into old habits.

Figure 2: Detailed breakdown of the each CIM stage including Performance Analytics, and Process Optimization (PO, green box) specific actions and analysis that can be deployed
In the following section, we will explore three real-life cases and explain how Performance Analytics, Benchmarking, and Process Optimization can play a part in supporting these cases.
Example I: Improve solution delivery speed
Now Platform capabilities:
- Benchmarking
- Process Optimization
- Virtual Agent
Fictive company ACME aims to improve their case solution speed as users generally appreciate when issues are solved quicker. ACME monitors their actual business performance with ServiceNow’s Benchmarking scores and notices an underperformance on average case resolution time compared to companies within their industry. To find out WHY this underperformance takes place, Process Optimization is used to analyze the designated process. Based on the analysis performed with Process Optimization, it appears that the majority of the cases created via the newly launched service portal go straight to an on-hold status whereby the agent reaches out to the requestor for more context around the case. Apparently, cases created via the new service portal are poorly described and unintentionally negatively impact the overall MTTR. Therefore, ACME decided to implement dynamic forms and deploy Virtual Agent on their service portal to improve the case intake by dynamically asking tailored follow up questions.

Figure 3: Possible user journey to improve the resolution speed of cases
Example II: SLA breach prevention
Now Platform capabilities:
- Performance Analytics
- Process Optimization
- Vendor Manager Workspace
ACME notices an increasing trend of their KPI “Average Age of Open Cases”. This leading indicator was developed to track MTTR and avoid SLA breaches as one of their key business objectives and is tracked using Performance Analytics. When drilling into breakdown performance, ACME identifies that the category database has a significantly longer average open age of cases than other categories. Now, ACME wants to understand WHY the category database is performing considerably slower than different categories. This is where Process Optimization comes in. From the indicator Average Age of Open Cases in Performance Analytics, ACME can jump into Process Optimization to directly execute process mining on the Incidents at hand.

Figure 4: ACME detects an increasing trend in the average age of open cases, then discovers through Process Optimization that Pending Vendor is causing a big delay, and finally decides to use Vendor Manager Workspace to get a 360 on vendor performance
After analyzing the process in Process Optimization, it appears that three days were lost on Pending Vendor state on average. As vendor performance was a blind spot for ACME, they decided to implement Vendor Manager Workspace to gain a 360-degree overview of performance, SLAs, meetings, and improvement initiatives.
Example III: High case reassignment count
Now Platform capabilities:
- Performance Analytics
- Process Optimization
- Process Optimization- Clustering Framework
- Predictive Intelligence - Classification Framework
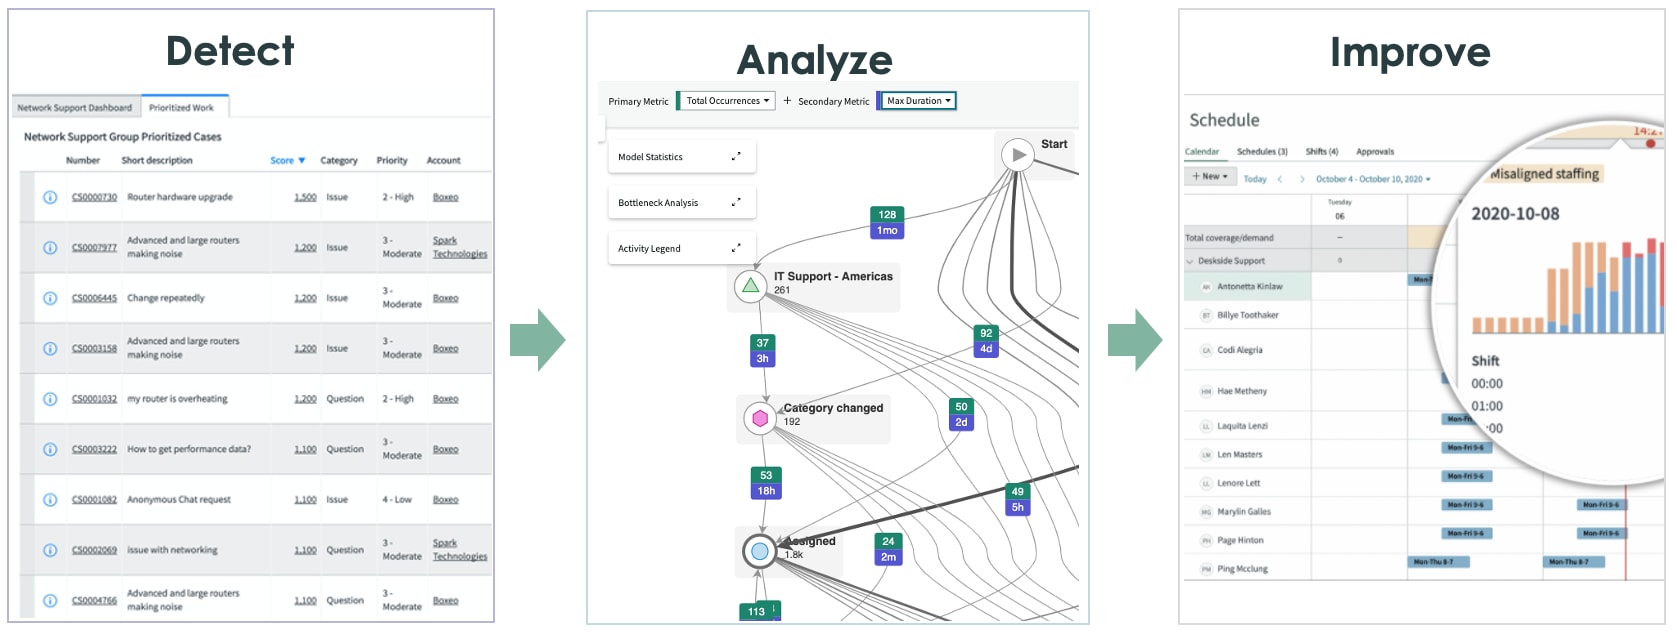
The management team at ACME have world-class customer satisfaction as their primary strategy for this year. They have identified “Average Reassignment Count” as a critical KPI impacting this goal. They want to reduce the Average Reassignment Count by 30% over the next six months. In their weekly management team session, ACME identified, using Performance Analytics forecasts capabilities (see Figure 5, Detect), that the Average Reassignment Count of open cases is increasing and will continue to do so in the following days if nothing happens. Although Performance Analytics showed which team eventually resolves cases with a high reassignment count, ACME wants to know which team is initially reassigning and WHY. The Process Optimization Analyst Workbench (see Figure 5, Analyze) shows instantly that IT Support is reassigning a significant part of their work. Finally, the analyst conducts an AI-powered root-cause analysis to understand that cases with category employee portals are often reassigned to another team.

Figure 5: Performance Analytics is integrated with the Process Optimization Summary and Insights dashboard showing that only 84.5% of incidents are correctly resolved the first time. The Analyst Workbench root cause analysis immediately identifies to the root cause of the problem causing the bad performance.
After creating a continuous improvement initiative, ACME implemented Predictive Intelligence Classification Framework for AI-powered assignment group classification so that cases are routed directly to the designated team.
Example IV: Team performance
Now Platform capabilities:
- Performance Analytics
- Process Optimization
- Workforce Optimization
- Skills Management
- Advanced Work Assignment
In the final real live example, ACME is looking into their Performance Analytics Spotlight dashboard.
Spotlight allows you to identify and rank cases of interest based on multiple weighted criterion. Two of ACME’s weighted criterion are the Time Since Last Update and Cases Not Assigned to Someone. Time Since Last Update indicates that the team cannot cope with the inflow anymore, causing cherry-picking to occur when team members have a skill gap. Recently, ACME saw a significant increase in cases matching both spotlight criterion. Process Optimization was used to analyze how effective each team was performing. Not surprisingly, ACME saw that particular types of cases were solved by only a few people in the group. Consequently, these team members were overwhelmed with work and KPIs such as Time Since Last Update were on the rise.

Figure 6: Performance Analytics Spotlight detects cherry-picking and increasing updates since last update. Process Optimization analyses intra team re-assignments and then helps to make improvements with planning and skills management delivered through Workforce Optimization.
Based on the findings, ACME decided to manage the team performance with Workforce Optimization proactively. Workforce Optimization enables ACME to manage and maintain the productivity of their workforce from a single location and efficiently manage their team's skills and schedules, route work assignments to teams, and monitor performance.
Conclusion
Both Performance Analytics and Process Optimization can play a role in detecting and analyzing process performance.
Performance Analytics allows for easy identification of undesired trends in predefined KPIs and breakdowns. It shows outliers, underperformance, trend disruptions, etc. In doing so, it tells you HOW your processes are performing and points out anything unusual.
Process Optimization uses log files of your executed processes to build a holistic view of how your organization runs. By showing the actual execution of your processes at a granular level, it provides insights into WHY your processes may be underperforming.
Built on the Now Platform, these capabilities complement each other to help you maximize the value of your investments by continually improving service processes across your organization.
Thanks for co-authoring:
- 8,451 Views