- Post History
- Subscribe to RSS Feed
- Mark as New
- Mark as Read
- Bookmark
- Subscribe
- Printer Friendly Page
- Report Inappropriate Content
on 07-18-2021 05:22 AM
It has been a while since I took some timeout to explore and implement some fun things on the Now platform. However, recently I was asked to find out the rights a role grants to the users, and it turned out there were several ACLs on several tables that the role was used on. I did a quick analysis and shared the findings, however, it had me start looking for some dynamic option that can be used to visualize role usage in relation to the ACLs.
My search took me back to the efficient D3.js. If you haven't used D3 yet, as per the homepage,
D3.js is a JavaScript library for manipulating documents based on data. D3 helps you bring data to life using HTML, SVG, and CSS. D3’s emphasis on web standards gives you the full capabilities of modern browsers without tying yourself to a proprietary framework, combining powerful visualization components and a data-driven approach to DOM manipulation.
First step with D3 is choosing a diagram from the vast array of possibilities. (Decision Paralysis is a thing guys). With some prior knowledge of collapsible tree structure and use case seemingly fitting into it, made the decision slightly easy this time. 🙂 Before we start though, this is a simplified final look

With that sorted, next step was to include the D3 source file into the code. Since, the idea was to show a link on Roles record itself, a dynamic UI Page seemed a simpler solution. Setting up the environment for using D3.js is very simple, one line inside the header to link to the D3 source and we're set.
Next step is to provide the data in the format that the tree expects. Again, it is quite straight-forward, the general syntax is like below
var treeData = [{
 "name": "Parent Node"
 "parent": null
  "children": [{
     "name": "first_child",
     "parent": "Parent Node",
  }]
}]
The parent-child relationship could be nested to multiple levels. And to get the proper data, we're going to query on the 'sys_security_acl_role' table and search for all active ACLs associated with a particular role. While processing the data on the Server Side, we can maintain the structure as above. For this example, we were looking at a depth of two i.e. a structure where parent role --> operation --> table/acl name. So, maintaining the structure wasn't that difficult. Once the Server Side is done with creation of the data structure, next step is to fetch this information on the client side of the UI Page and let the D3 magic unfold.
To do that easily, we're using the 'object=true' property of the <g2: evaluate> tag and fetching this information in the client script simply by using the jelly syntax of ('$[jvar_variable_name]'); To make it easier to understand, below is our server side tag
<g2:evaluate var="jvar_treedata" object="true">JSON information for tree data is stringified before returning in above evaluate tag. On the client side, we retrieve this information as
root = JSON.parse('$[jvar_treedata]');To actually render the information on the Client Side, we're referring to this code. The article best explains the basics of using D3, you can also refer to several articles/tutorials from D3 homepage itself to get familiar with the concept. (Yes, I'm skipping explaining D3 itself.. 😛 )
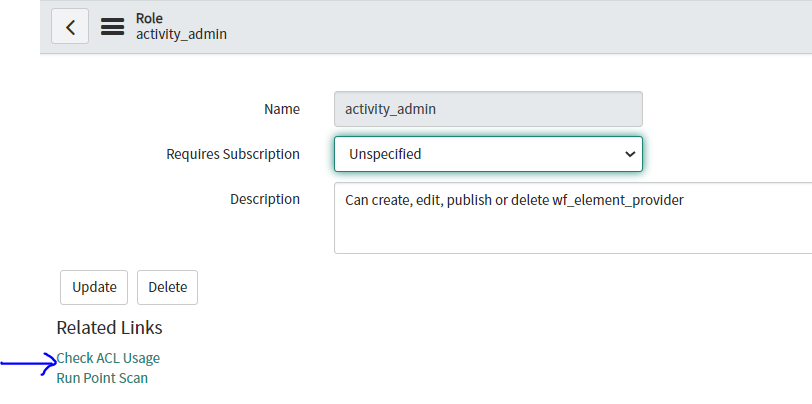
Another part to complete the puzzle is adding a UI Action on the Role's form and passing the role name dynamically to our UI Page. With that in place, you should be able to see a related like this below on your form.

I've added a simple share project as well, Give it a try and let the power of D3 mesmerize you.
- 2,391 Views
- Mark as Read
- Mark as New
- Bookmark
- Permalink
- Report Inappropriate Content
really good... I've always been impressed w/ D3 (Observable)... I don't understand why more isn't done with it.