- Post History
- Subscribe to RSS Feed
- Mark as New
- Mark as Read
- Bookmark
- Subscribe
- Printer Friendly Page
- Report Inappropriate Content
on 06-17-2020 12:00 AM
How to Debug Server Side Code on ServiceNow
When we develop applications or integrations on the ServiceNow platform, we write both server-side and client-side code. Debugging varies a lot in ServiceNow for client-side and server-side code.ServiceNow provides various debugging tools and techniques within the platform for debugging Server Side scripts.
ServiceNow Server Side Debugging Script
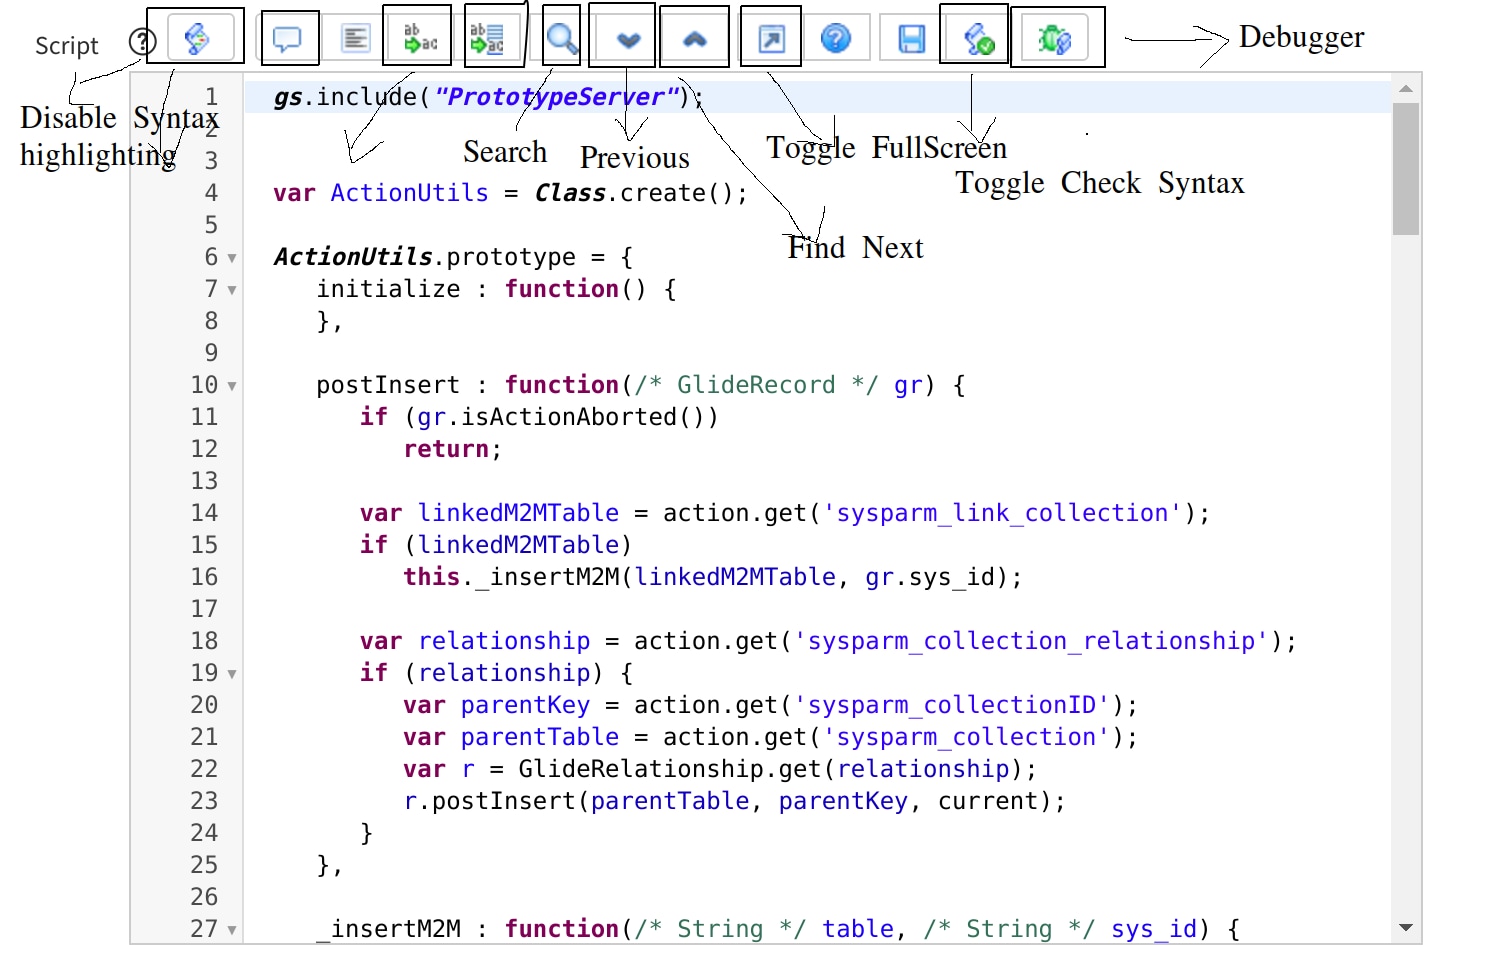
ServiceNow Server Side scripts can be written in Script Include, Business Rules, Exposing Rest API, and at many other places. ServiceNow Provides Syntax Editor for writing javascript server code in the ServiceNow platform.You may use your IDE like Visual Code, But most of the ServiceNow Server Code is written in Syntax Editor.
Various parts of Syntax Editor Include :

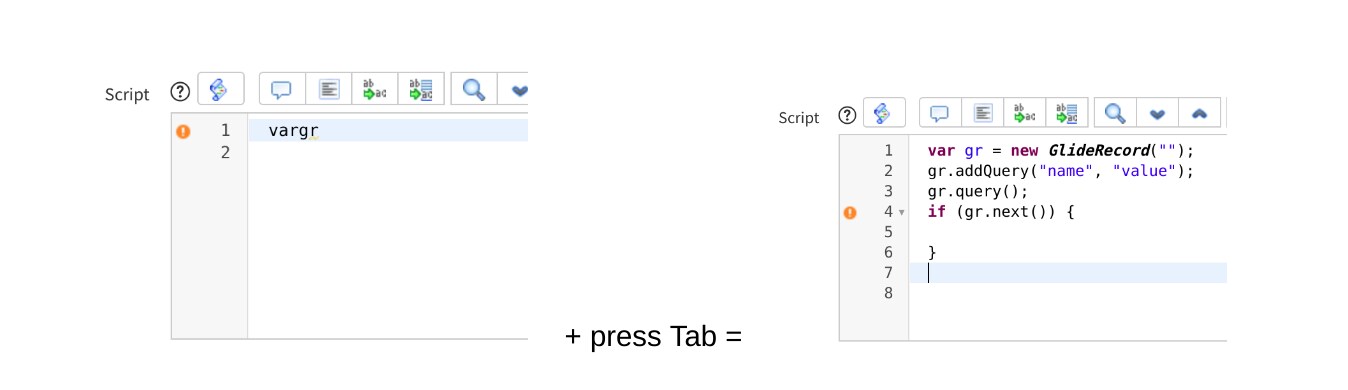
Syntax Editor Macros (Magical keywords in ServiceNow )
ServiceNow Provides an excellent Feature of Macros :
Macros Help in Quickly generating code in ServiceNow syntax editor :

One keyword has generated your barebone codes.
Available set of Macros in ServiceNow are :
- doc - Generates Document Header
- for - generate For loop Code
- vargror - generates code for gliderecord query
- Method - generates code for empty method
- vargr - generates code for creating or query glide record
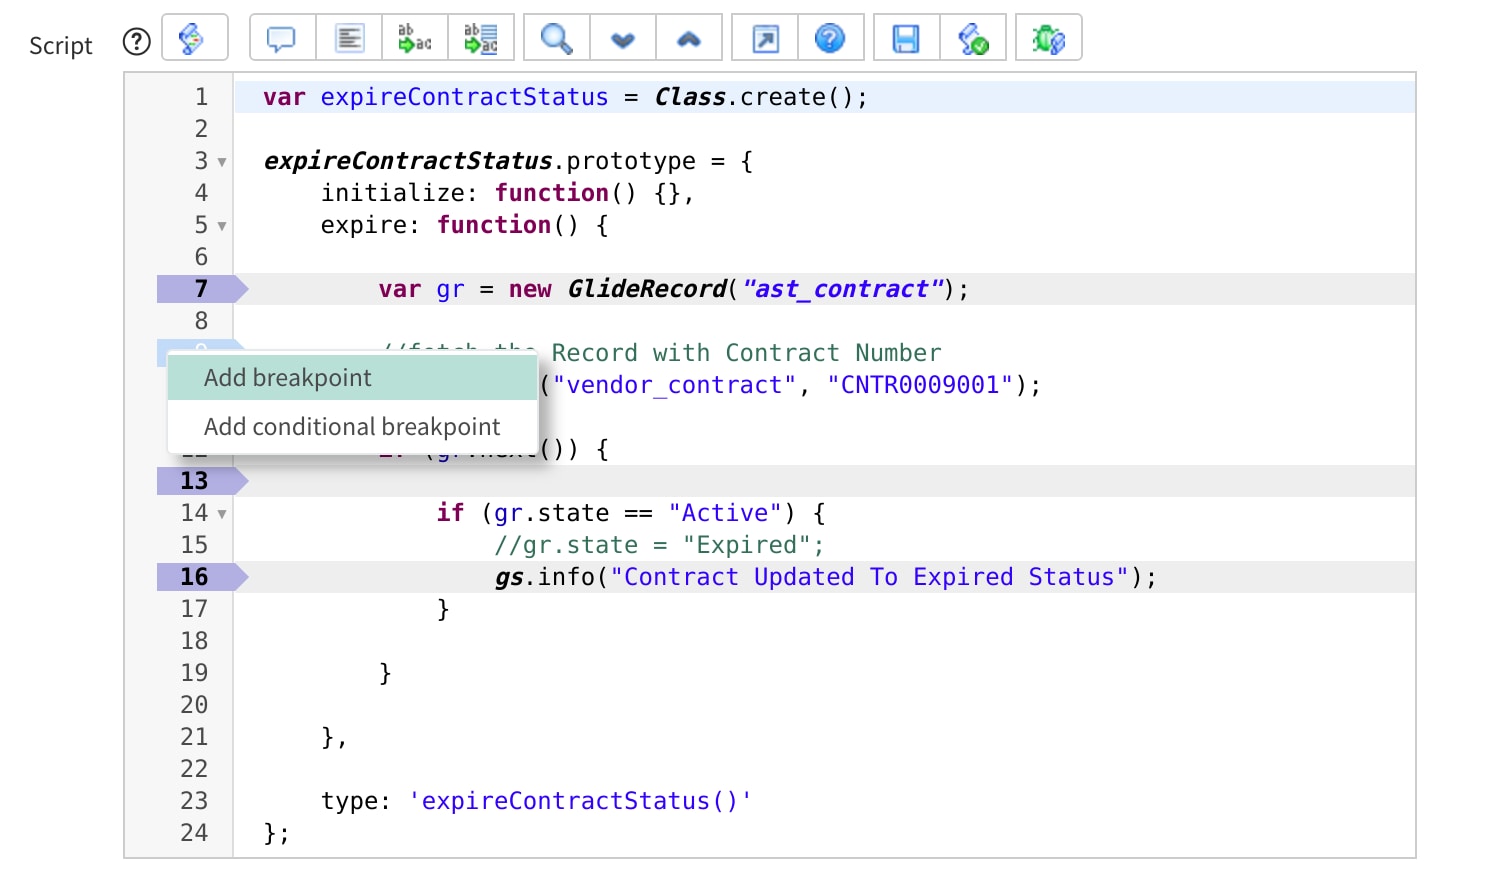
ServiceNow Server-Side Script Debugger
Script Debugger can be used to debug ServiceNow Line-by-Line debugging, just like we use breakpoints for debugging our python or java code on our favorite editor.
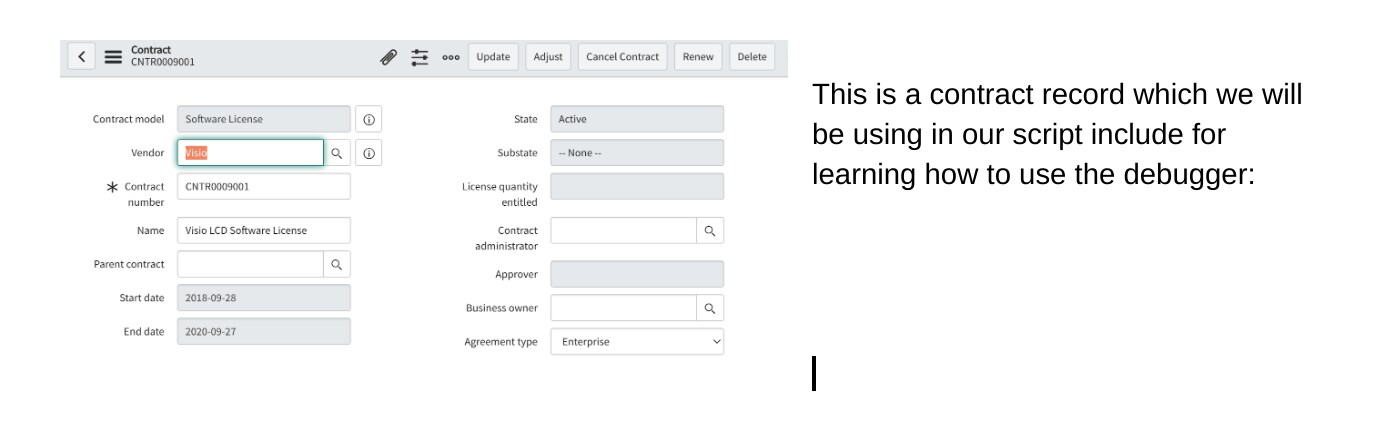
I create a small script include that changes the status of the contract on the “ast_contract”(Contract Module) table.

Following is a script include named expireContractStatus, which has a method called expire() that will be used to change the status of the contract.

We can Launch our debugger by clicking the debug button and here is how elegant the ServiceNow debugger looks like.

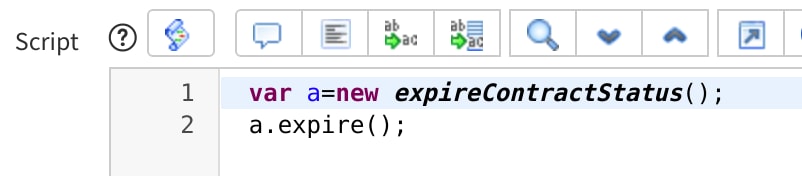
Currently, the debugger is in the inactive stage, to set it into the active stage we will have to call this script include method.
In order to call this script include I can make a temporary fix script to run it.

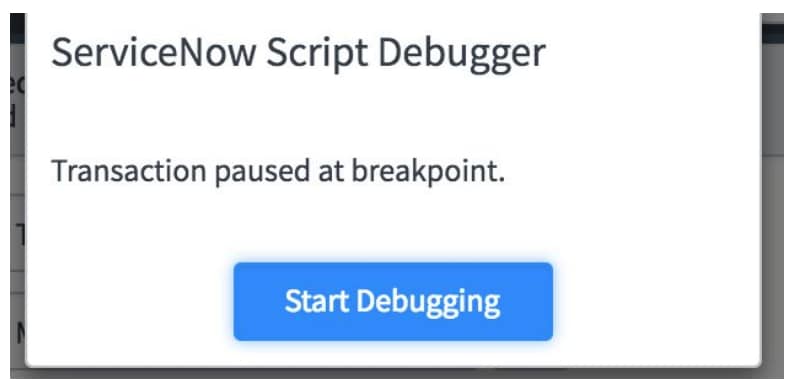
As soon as I run the script include, I get to see a javascript alert saying execution is on the breakpoint.

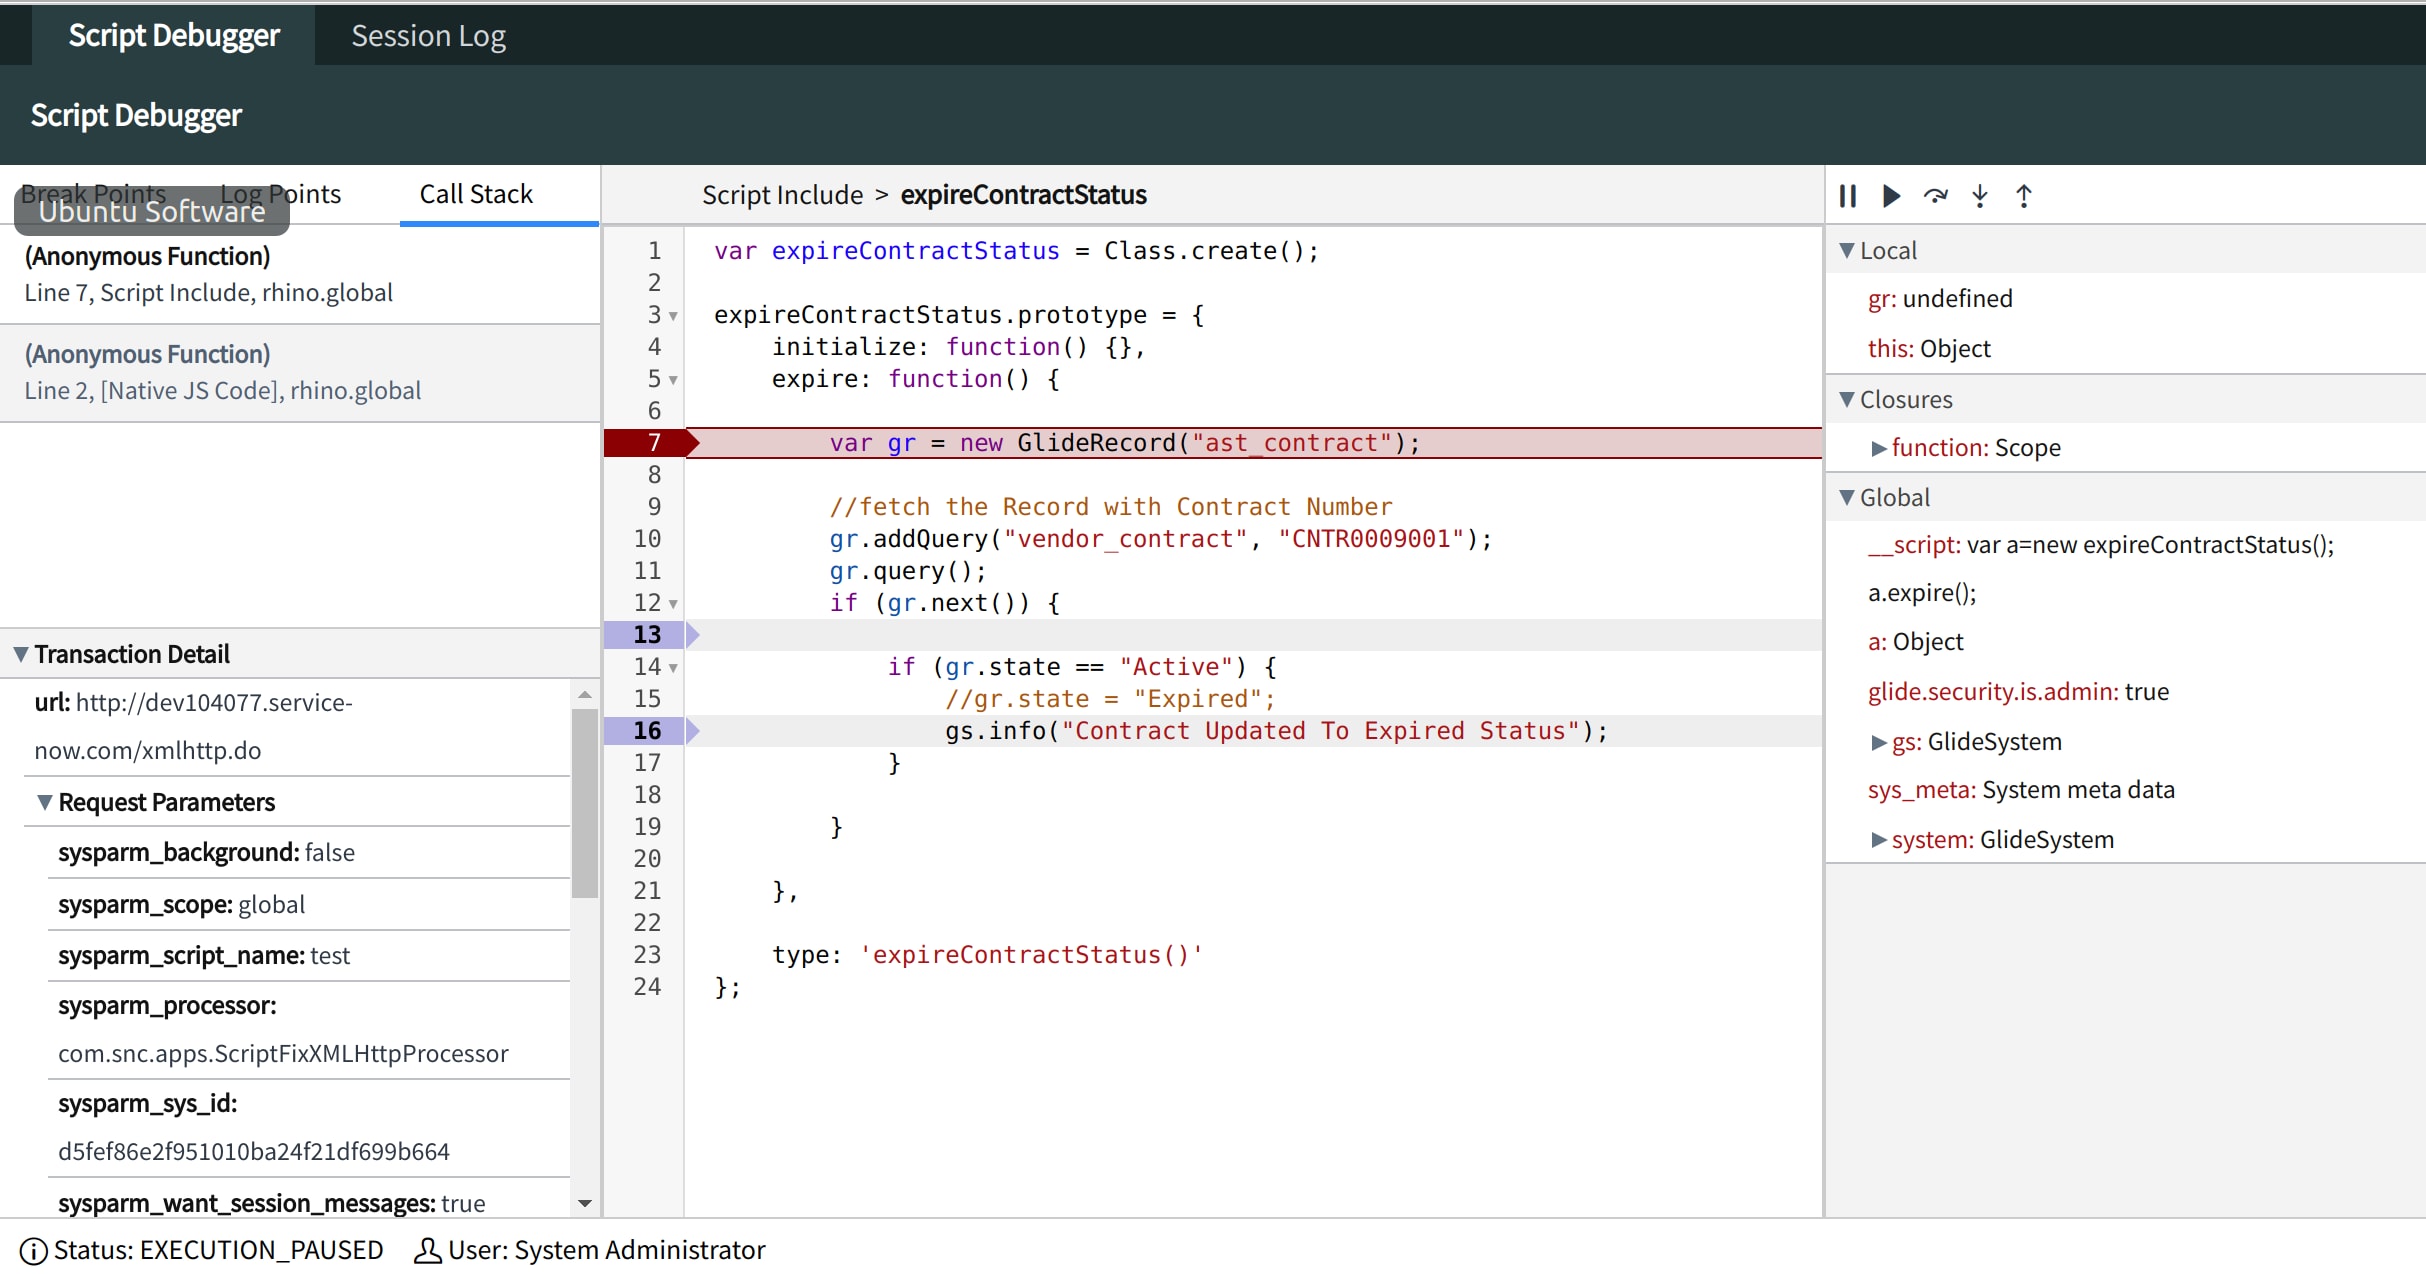
Now I can see my debugging panel live, as variables and data are populated.

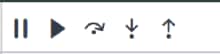
My Debugger is waiting at First Breakpoint, I can use the controls present on the right-hand side to control the flow of execution.
- Flow Control Buttons: they are used for controlling the flow of debuggers.
- Call stack: this is where the method calls are populated as the flow continues.
- Transaction Details: This mostly constraints information about the request, URL, Session Details.
- Variables: it contains variables that are present while execution of the code, and their values changes
-
- Local Variables: variables in Local scope.
- Global Variables: Variables in Global Scope.
- Clouser Variables: Function scope variables.

My Self Anand Trivedi has been working on ServiceNow Apps and Machine learning/Virtual Agent and on how to integrate machine learning/Virtual Agent with Servicenow with Aavenir.
Aavenir has developed an enterprise-class Contract Management solution, natively on ServiceNow, that uses the Machine Learning from Amazon while storing and executing all contract management functions on ServiceNow.
Do find my other Article also on How to Integrate AWS with Service Now on Machine learning Here .
- 6,894 Views