Performance issues across entire system all users
- Mark as New
- Bookmark
- Subscribe
- Mute
- Subscribe to RSS Feed
- Permalink
- Report Inappropriate Content
03-16-2016 09:55 AM
We are having some very impactful performance issues in our instance. We are concerned because we are on the verge of populating our CMDB with multiple data sources -- but we aren't comfortable proceeding considering the system performance is already terrible. Most of the time pages are just very slow to load, but other times the page does not load at all and the browser crashes.
The issue affects ALL users in ALL areas of the system. The issue is affecting production as well as dev and test instances.
We are seeing client transaction times around 15 seconds, some as high as 20 seconds.
I opened a ticket with support but they gave us the run-around with insufficient answers, such as checking homepage refresh times. They were dismissive and tried to mark the incident as resolved without giving us any real solutions.
They checked out the health of our nodes and explained that everything seemed normal. We moved data centers about a month ago and we have requested moving back to the old data center to see if that might have been the cause of the issue.
Still, we are skeptical and extremely unhappy.
The issue cannot be homepage refresh times since the same issue is impacting both Dev and Test where there is only ONE user working there on a daily basis.We are a small company and we only have about 40 users in the system.There is no way that homepage refresh times are causing such response issues.
I checked all of the performance graphs on CPU, JVM memory, SQL transactions, etc. I don't see anything obvious in those graphs to indicate a problem.
Attached is a screenshot of the client response times which is very slow.
We are on Fuji Patch 10. The issue started about a month ago and has gotten worse in the past few weeks.
Has anyone experienced similar issues? We are not sure how to proceed considering the lack of real help from support.
- Mark as New
- Bookmark
- Subscribe
- Mute
- Subscribe to RSS Feed
- Permalink
- Report Inappropriate Content
06-03-2016 07:53 AM
Hello jan_m, THIS IS GREAT ADVICE! Thank you for pointing me at these tables.
I'm not able to find a table named IOSTATS, can you give me the name to use? ( I'm on Geneva Patch 5 )
I did check the Slow Queries table and I found several possibilities.

I took you advice to show queries over 3,000 ms, and then I sorted by total execution time.
Now I need to find out why these queries are running.
- Mark as New
- Bookmark
- Subscribe
- Mute
- Subscribe to RSS Feed
- Permalink
- Report Inappropriate Content
06-05-2016 11:59 PM
Hi,
You can find the IOStats table through its own module:
System Diagnostics > Stats > Table IOStats
Or view the data on the xmlstats page (here with iostats data only filttering on).
http://yourinstance.com/xmlstats.do?include=iostats
The data is from the application node that you are currently logged on and the cumulative data is viewable on the table itself.
If you are on Geneva patch 5 it is worthwhile to have a look at this KB-article.
"PRB663533: User presence causes performance degradation when Connect, UI16, Mobile Support, or VTB is installed due to transactions related to the Presence feature"
https://hi.service-now.com/kb_view.do?sysparm_article=KB0584123
"As a result, blank screens, lag, and other delays may only be present at certain times…"
Seen in:
Geneva 1-5 patch
Fixed in:
Geneva Patch 7
Helsinki
BR,
Jan
- Mark as New
- Bookmark
- Subscribe
- Mute
- Subscribe to RSS Feed
- Permalink
- Report Inappropriate Content
06-06-2016 06:47 AM
Hi,
How are your default semaphores performing?
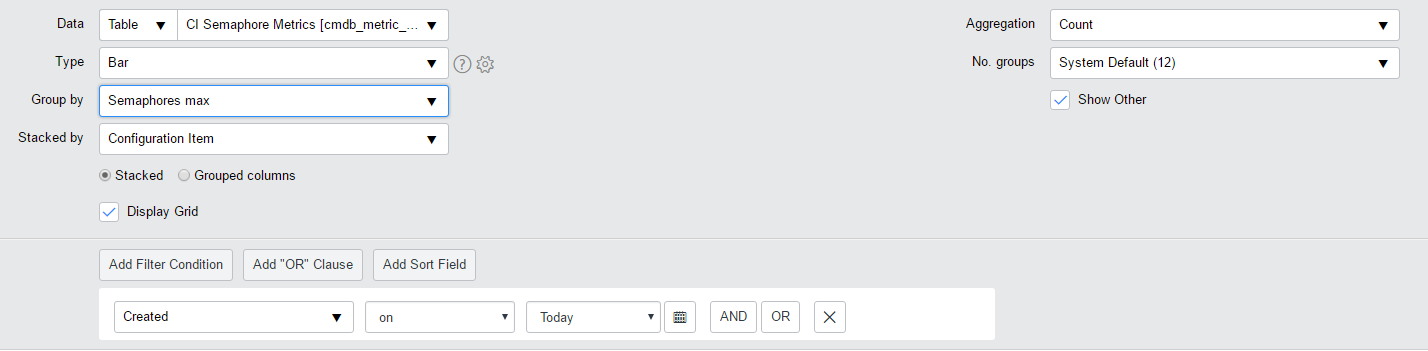
Add this report to your system (CI Semaphore Metrics table).

This gives you semaphore metrics data grouped by semaphore max value / 60 second and stacked by application node server.
You should probably not have a lot off hits in the 10 - 16 range. This could incidate some kind of resource problem.

- Jan
- Mark as New
- Bookmark
- Subscribe
- Mute
- Subscribe to RSS Feed
- Permalink
- Report Inappropriate Content
06-06-2016 07:43 AM
Jan,
Very nice. I ran the report and all my configuration items came up as "empty". What did I do wrong?
Greg
- Mark as New
- Bookmark
- Subscribe
- Mute
- Subscribe to RSS Feed
- Permalink
- Report Inappropriate Content
06-07-2016 12:38 AM
Hi,
We are on an on-premises instance, so I don't exactly know how the data is visible in the cloud infrastucture.
I tested the report on my developer instance and I do see the data.

Were you logged in as an admin? The data regarding the instances and discs that are viewable in the Servicenow Performance homepage are in the
https://yourinstance.service-now.com/cmdb_ci_list.do?sysparm_query=sys_class_name%3Dcmdb_ci_snc_comp...table (class = SCN Component).
Can you view this data in the browser and do you see values in the Name column?
- Jan