- Subscribe to RSS Feed
- Mark as New
- Mark as Read
- Bookmark
- Subscribe
- Printer Friendly Page
- Report Inappropriate Content
I finally wrestled this to the ground and decided it is time to post my modest script for Custom Charts in the hope that someone can benefit:
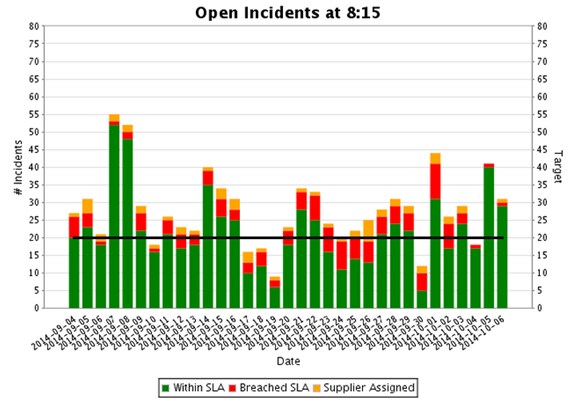
The Chart:


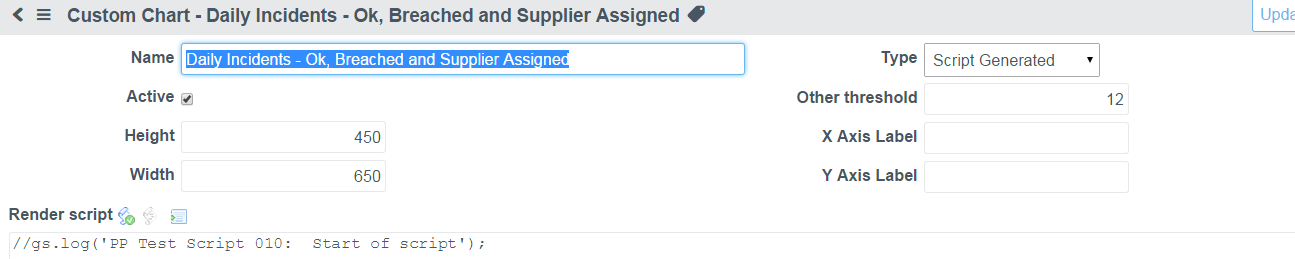
The Script:
//gs.log('PP Test Script 010: Start of script');
//***************************************************************************************
//
// This script produces a stacked bar chart of incidents within SLA, Breached SLA and
// Supplier Assigned tickets (breached and not-breached)
//
// Note: some files are site specific (e.g. u_resolved_at - the DateTime the incident was resolved
//
// There are many quirks with jFree Chart support, Summary Sets, etc. that I couldn't figure out so
// this represents a lot of trial and error but should give some pointers to using jFree Charts in Service Now
//
// Note: all work was done in Eureka!
//
// Paul Plato - October 2014 - Toyota Motor Manufacturing Canada
//
// Feel free to use within Service Now but no guarantees are made on this script!
//
//***************************************************************************************
// Define number of days to show on the report
var num_days = 33;
// lookup the sysid for Managed Print Service group
var group_mps = new GlideRecord('sys_user_group');
group_mps.get('name', 'Managed Print Service');
var mps = group_mps.sys_id;
// get today's date and force 08:15:00 time
var today_815 = GlideDateTime();
var today_date = today_815.getValue();
var today_date_only = today_date.substr(0, 11);
today_815.setDisplayValue(today_date_only + "08:15:00");
// Get Number of Days to go back (days_to_report) days ago at 08:15:00
var days_to_report = 0 - num_days;
var days_ptr = GlideDateTime();
days_ptr.setGlideDateTime(today_815);
days_ptr.addDaysLocalTime(days_to_report);
//gs.log('PP Test Script 020: Today : ' + today_815.getDisplayValue());
//gs.log('PP Test Script 030: ' + days_to_report + ' days ago: ' + days_ptr.getDisplayValue());
// create needed variables
var count_ok = new GlideAggregate('incident');
var count_nl = new GlideAggregate('incident');
var count_ng = new GlideAggregate('task_sla');
var count_sa = new GlideAggregate('incident');
var inc = "incident";
var this_datetime = ' ';
var this_date = ' ';
var incidents_all = 0;
var incidents_ok = 0;
var incidents_nl = 0;
var incidents_ng = 0;
var incidents_sa = 0;
// To define a data set for the bar chart, we create an instance of type CategoryDataset.
var dataset = new Packages.org.jfree.data.category.DefaultCategoryDataset();
// Dummy up the target data for the target line
var datatarg = new Packages.org.jfree.data.category.DefaultCategoryDataset();
for (var i = 0; i < num_days; i++) {
// add one day
days_ptr.addDaysLocalTime(1);
// get just the date for the graph
this_datetime = days_ptr.getValue();
this_date = this_datetime.substr(0, 11);
// Get count of tickets opened before 8:15 and already resolved (unresolved at that time will be added later)
count_all = new GlideAggregate('incident');
count_all.addQuery('opened_at', '<', days_ptr);
count_all.addQuery('u_resolved_at', '>', days_ptr);
count_all.addQuery('assignment_group', '!=', mps); // exclude "Supplier Assigned" tickets
count_all.addAggregate('COUNT');
count_all.query();
incidents_all = 0;
if (count_all.next())
incidents_all = count_all.getTotal('COUNT')
else
incidents_all = 0;
// Get count of tickets open at 8:15 of that day not yet resolved (u_resolved_at is NULL, only include active ones
// to exclude some old tickets that had this field blank
count_nl = new GlideAggregate('incident');
count_nl.addQuery('opened_at', '<', days_ptr);
count_nl.addNullQuery('u_resolved_at'); // Null u_resolved_at Date (Resolution Time)
count_nl.addActiveQuery(); // only active ones!
count_nl.addQuery('assignment_group', '!=', mps); // exclude "Supplier Assigned" tickets
count_nl.addAggregate('COUNT');
count_nl.query();
incidents_nl = 0;
if (count_nl.next())
incidents_nl = count_nl.getTotal('COUNT')
else
incidents_nl = 0;
// Get count of tickets open at 8:15 of that day and HAVE breached
count_ng = new GlideAggregate('task_sla');
count_ng.addQuery('start_time', '<', days_ptr);
count_ng.addQuery('end_time', '>', days_ptr);
count_ng.addQuery('has_breached',true);
count_ng.addQuery('task.number', 'STARTSWITH','INC'); // Only include Incidents from the TASK_SLA table
count_ng.addQuery('task.u_resolved_by_group','!=', mps); // exclude "Supplier Assigned" tickets
count_ng.addAggregate('COUNT');
count_ng.query();
incidents_ng = 0;
if (count_ng.next())
incidents_ng = count_ng.getTotal('COUNT')
else
incidents_ng = 0;
// Debugging - look at intermediate values to solve issues with
//gs.log('PP Test Script ~A~' + i + '~: Date: ' + days_ptr.getDisplayValue() + ' <=> Count ~ALL~: ~' + incidents_all );
//gs.log('PP Test Script ~A.5~' + i + '~: Date: ' + days_ptr.getDisplayValue() + ' <=> Count ~ALL~: ~' + typeof incidents_all );
//gs.log('PP Test Script ~B~' + i + '~: Date: ' + days_ptr.getDisplayValue() + ' <=> Count ~NL~: ~' + incidents_nl );
//gs.log('PP Test Script ~B.5~' + i + '~: Date: ' + days_ptr.getDisplayValue() + ' <=> Count ~NL~: ~' + typeof incidents_nl );
//gs.log('PP Test Script ~C~' + i + '~: Date: ' + days_ptr.getDisplayValue() + ' <=> Count ~NG~: ~' + incidents_ng );
//gs.log('PP Test Script ~C.5~' + i + '~: Date: ' + days_ptr.getDisplayValue() + ' <=> Count ~NG~: ~' + typeof incidents_ng );
incidents_ok = incidents_all + incidents_nl - incidents_ng; // OK tickets include all tickets resolved and not resolved, minus Breaches
//gs.log('PP Test Script ~D~' + i + '~: Date: ' + days_ptr.getDisplayValue() + ' <=> Count ~OK~: ~' + incidents_ok );
//gs.log('PP Test Script ~D.5~' + i + '~: Date: ' + days_ptr.getDisplayValue() + ' <=> Count ~OK~: ~' + typeof incidents_ok );
// Add Ok and Breached number of tickets to the Dataset for charting
dataset.addValue(incidents_ok, "Within SLA", this_date);
dataset.addValue(incidents_ng, "Breached SLA", this_date);
// Get count of tickets open at 8:15 that are just Supplier Assigned - i.e. Managed Print Service group
count_sa = new GlideAggregate('incident');
count_sa.addQuery('opened_at', '<', days_ptr);
count_sa.addQuery('u_resolved_at', '>', days_ptr);
count_sa.addQuery('assignment_group', mps);
count_sa.addAggregate('COUNT');
count_sa.query();
var incidents_sa = 0;
if (count_sa.next())
incidents_sa = count_sa.getTotal('COUNT')
else
incidents_sa = 0;
//gs.log('PP Test Script ~E~' + i + '~: Date: ' + days_ptr.getDisplayValue() + ' <=> Count ~SA~: ~' + incidents_sa );
// Add Supplier Assigned number of tickets to the Dataset
dataset.addValue(incidents_sa, "Supplier Assigned", this_date);
// add target row - note, couldn't figure out how to do this using gfree charts draw function!
datatarg.addValue(20, "Target", this_date);
} // end of the while loop
// Use ServiceNow Wrapper since some of the base jFree Chart objects don't seem to work
var barr = new ChartGenerator("bar");
// Indicate a Stacked Bar
barr.setStacked();
// Get the jFree Chart "Chart" object so we can manipulate it
var chart = barr.getChart(dataset);
// Get the jFree Chart Plot object and modify the background
var plot = chart.getPlot();
// Set plot background light Gray - commented out for now
//plot.setBackgroundPaint(Packages.java.awt.Color.lightGray);
// Set Axis labels and cap at 80 incidents ==> keeps the charts consistent each day and a kluge because
// I can't figure out how to have the Target Line use the first (left) value range, forcing the bars and lines
// to Max at 80 was a work-around
axisD = plot.getDomainAxis();
axisD.setLabel("Date");
axisV = plot.getRangeAxis();
axisV.setLabel("# Incidents");
axisV.setRange(0,80);
// Change Series Colors to Match the original report
rendererBar = plot.getRenderer();
rendererBar.setSeriesPaint(0, Packages.java.awt.Color(0.0,0.5,0.0));
rendererBar.setSeriesPaint(1, Packages.java.awt.Color(1.0,0.0,0.0));
rendererBar.setSeriesPaint(2, Packages.java.awt.Color(1.0,0.647,0.0));
rendererBar.setDrawBarOutline(false);
// Create a new Line chart for the target line (couldn't figure out how to draw a target line)
var line = new ChartGenerator("line");
var renderer = line.getChartGenerator().getLineRenderer(Packages.java.awt.Color.BLACK, 3.0, false, false, false);
barr.addRenderer(renderer, datatarg, false, "Target");
// set Max on target axis to 80 so it matches the main Range Axis (I can't figure out how to force to use the
// first Range Axis
axisV2 = plot.getRangeAxis(1);
axisV2.setRange(0,80);
// Change the title
chart.setTitle("Open Incidents at 8:15");
// return our chart
answer = chart;
//gs.log('PP Test Script 100: End of Script');
You must be a registered user to add a comment. If you've already registered, sign in. Otherwise, register and sign in.