- Mark as New
- Bookmark
- Subscribe
- Mute
- Subscribe to RSS Feed
- Permalink
- Report Inappropriate Content
08-03-2026 09:19 AM
Hi,
I am new to CMDB and would appreciate some guidance.
In the CMDB Health Dashboard, if we naigafte to cmdb health dashboard > class view > if we change to managed classes and health group I can see the Completeness score (currently showing 26%).

My requirement is to display this same Completeness metric in a different dashboard/view, specifically in the Trend View. However, I am unable to determine how this percentage is being calculated or where the underlying configuration is defined.
I have already explored the cmdb_health_result table, but I am still unable to identify:
Which table or data source is used to calculate the Completeness percentage.
Thanks in advance😊
Solved! Go to Solution.
- Mark as New
- Bookmark
- Subscribe
- Mute
- Subscribe to RSS Feed
- Permalink
- Report Inappropriate Content
08-05-2026 11:32 PM
Hi,
I tried this out on my own PDI. Here's what worked for me.
Setting up the data
Source type is Table, and the table is CMDB Group Health Scorecard (cmdb_health_scorecard_group). For the conditions I used Metric is Completeness, and CMDB group is HEALTHFIX Group.
Picking the chart type
Type "trend" in the search box and pick Time series. It doesn't show up in the normal chart list, so it's easy to miss.
Configuring it
Set Trend by to Evaluated On, Calendar to Standard, and per to Day. Aggregation is Average.
The function field
Two things to watch here.
When you click Configure function field, you get a popup saying you need to save the report first. Click Save and continue. So give the report a name before you get to this step, otherwise you'll be stuck wondering why nothing opens.
Then in the definition box put:
glidefunction:subtract(100,score)
Set Return type to Whole number. You should see "Syntax is correct for this function" once it checks it.
What this does is take the score away from 100. Whether that's what you want depends on how your instance stores the score, so have a look at the actual numbers in the table first.
Once you save, the function field shows up in the Aggregation dropdown and the chart will draw.
I've attached screenshots from my PDI.
Please Mark Helpful, if my Reply added any Value.
Regards
Raghavendra G
- Mark as New
- Bookmark
- Subscribe
- Mute
- Subscribe to RSS Feed
- Permalink
- Report Inappropriate Content
08-03-2026 10:47 PM
Hi ,
Sharing a reference which may help you:
1. CMDB Health Dashboard — Completeness, Compliance &... - ServiceNow Community
Please mark this response as Helpful or Correct if it helped.
- Mark as New
- Bookmark
- Subscribe
- Mute
- Subscribe to RSS Feed
- Permalink
- Report Inappropriate Content
08-03-2026 11:35 PM
Hi,
To the point straight - There is no table that stores 26% — the dashboard computes it at display time.
The two tables involved do different jobs:
cmdb_health_result — one row per failing CI, per submetric. It only records failures, so there's no percentage in it. This is why you couldn't find the number here.
cmdb_health_scorecard — the summary the dashboard reads. One row per class per metric, with total, failed, and score.
The important part: "score" field on the cmdb_health_scorecard is the failure percentage, not the health percentage. The dashboard displays 100 - score. So for your 26% tile, the stored value is 74.
Now the evidence part.
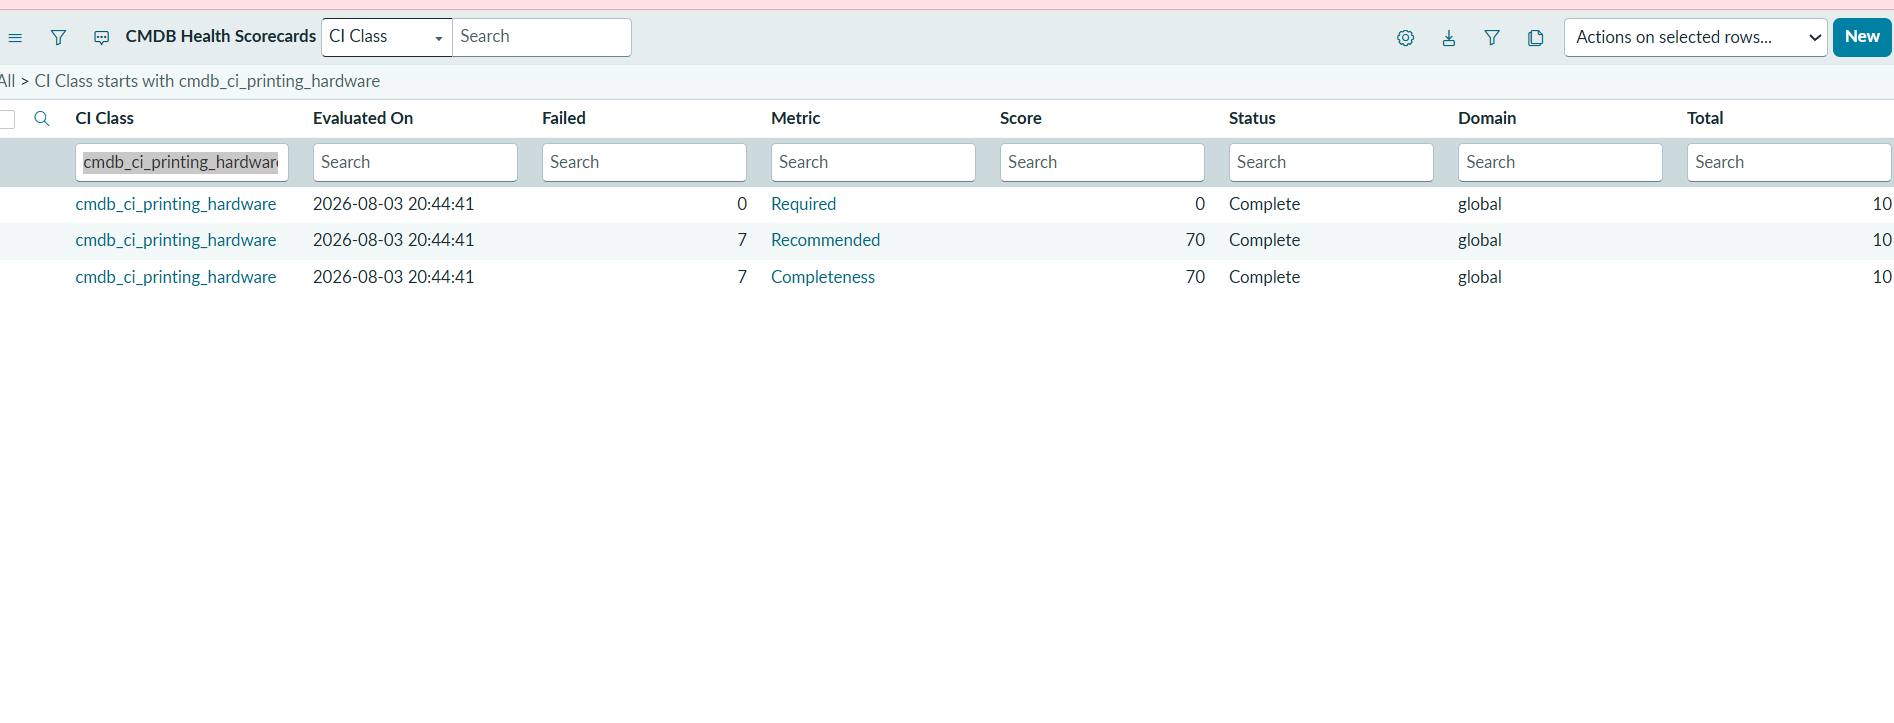
I picked cmdb_ci_printing_hardware table to prove my hypothesis.
Step 1: I went to CI Class Manager, Selected --> Printing Hardware Class --> Under Health ---> selected Completeness ---> selected Asset Tag and Serial Number and clicked on Save. (Refer Screenshot1)
Step 2: I created 10 test CIs in cmdb_ci_printing_hardware. Out of 10, I entered both Asset tag and Serial number for 3 CIs. The remaining 7 are missing one or both fields. (Refer Screenshot2)
Step 3: I opened CMDB Health Dashboard, clicked on Class and Printing Hardware, I see Completeness percentage as 30%. (Refer Screenshot3)
Step 4: Now open cmdb_health_result table, notice that there are 7 records, that means one record per one failed CI per Metric. Note 3 of my CIs are missing both fields, but each still created only one row here — this table records failing CIs, not missing attributes. (Refer Screenshot4)
Step 5: Nowopen cmdb_health_scorecard table, you see one record per one metric. The Completeness row shows Total 10, Failed 7, Score 70. And the dashboard showed 30%. 100 - 70 = 30. (Refer Screenshot5)
You can check the same on your instance — open cmdb_health_scorecard, filter on your class and Metric = Completeness, and you should see 74 in the Score field.
Please Mark Helpful, if my reply added any Value to your Question.
Regards
Raghavendra G
- Mark as New
- Bookmark
- Subscribe
- Mute
- Subscribe to RSS Feed
- Permalink
- Report Inappropriate Content
08-04-2026 06:43 AM
@RaghavendraGund thanks for your response
My query is when I select managed classes, I get completeness score and correctenss score as well. This is OOB
I want to understand how this calculation happening for the "managed classes" . I need to replicate the same with different report type (trend line)
Could you please help me with where this configuration is build and the percentage calculation is happening
- Mark as New
- Bookmark
- Subscribe
- Mute
- Subscribe to RSS Feed
- Permalink
- Report Inappropriate Content
08-04-2026 06:46 AM
I have a query regarding the Managed Classes functionality in CMDB Health.
When I select one or more Managed Classes, the system automatically displays the Completeness Score and Correctness Score. As I understand, this is standard out-of-the-box (OOB) functionality.
I would like to understand how these scores are calculated behind the scenes. Specifically, I am looking for the following information:
Where is the configuration for the Managed Classes score calculation defined?
Which tables, scripts, jobs, or reports are responsible for calculating the Completeness and Correctness percentages?
How is the percentage calculation performed for the selected managed classes?
Is the calculation based on CMDB Health Result records, CMDB Health Metrics, or any other underlying data source?
Which report or data source is used to populate these values in the UI?
The reason I am asking is that I need to build a Trend Line report that replicates the same Completeness and Correctness percentages for managed classes over a period of time