Assessment Simulator Task 6: Create a Dashboard and Add a Visualizaiton
- Mark as New
- Bookmark
- Subscribe
- Mute
- Subscribe to RSS Feed
- Permalink
- Report Inappropriate Content
10-02-2025 02:18 AM
Hi
I am having issues with step 6 primarily but even step 4 I am not sure I have done correctly. Below are the instructions:
------
As a Platform User, you want to create a dashboard where you can quickly view the status of incidents you are responsible for.
1. Create a new dashboard and name it My Incidents Overview.
2. From your Favorites > My Incidents list, create a bar chart from the Priority column.
3. In the Visualization Designer, name the chart Incidents by Priority.
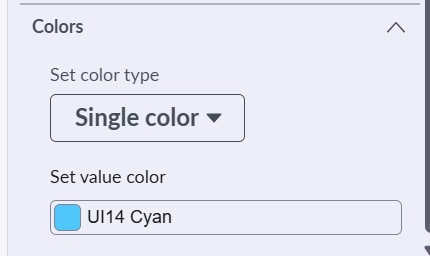
4. In the Visualization Designer, change the color of the chart to use the Color Palette, Default UI14.
5. Save the visualization.
6. Navigate back to the My Incident Overview dashboard and add the Incidents by Priority chart.
---------
Step 4: The color only allows me to choose from a range of options when I search for UI14. There isn't one that I can see called Default. So I chose Ui14 Cyan randomly. Is this correct, and if not, what should I choose.
Step 6: When I am at the My Incident Overview dashboard there is no option to add the Incidents by Priority Chart.
Also, I have watched one of the help videos on youtube but the interface looks different and is from a year ago. So I don't have the same options to choose as on that video.
Please advise.
Thanks
- Mark as New
- Bookmark
- Subscribe
- Mute
- Subscribe to RSS Feed
- Permalink
- Report Inappropriate Content
11-19-2025 01:04 AM
I encountered the same issue as you. I followed the steps shared by Tera Patron, but it failed validation. I tried many times to pass, but each time I failed. Finally, I clicked the save button after step 6 before clicking the validation button, and it passed. It's tricky because the test doesn't mention clicking the save button in the final step. It would be helpful to add "7. Click the save button" after "6. Navigate back to the My Incident Overview dashboard and add the Incidents by Priority chart" in the Task Instructions.
- Mark as New
- Bookmark
- Subscribe
- Mute
- Subscribe to RSS Feed
- Permalink
- Report Inappropriate Content
11-21-2025 05:05 AM
It worked for me
- Mark as New
- Bookmark
- Subscribe
- Mute
- Subscribe to RSS Feed
- Permalink
- Report Inappropriate Content
2 weeks ago
This worked for me. Thank you
- Mark as New
- Bookmark
- Subscribe
- Mute
- Subscribe to RSS Feed
- Permalink
- Report Inappropriate Content
01-06-2026 10:19 AM
For Step 6, Click on Add to dashboard and select "existing dashboard" and add it to the one you created with the name "My Incidents Overview". Save the dashboard again and validate the task. It works.
- Mark as New
- Bookmark
- Subscribe
- Mute
- Subscribe to RSS Feed
- Permalink
- Report Inappropriate Content
01-22-2026 05:47 AM
Have a query regarding this Step 6:
where can we find "Add to dashboard" option so i can proceed with selecting existing dashboard and add it with "My Incidents Overview", Let me know, it would be helpful if you can share a screenshot for reference.