Reporting: How to display SLA attainment as a percentage in a line graph
- Mark as New
- Bookmark
- Subscribe
- Mute
- Subscribe to RSS Feed
- Permalink
- Report Inappropriate Content
07-11-2025 08:16 AM - edited 07-11-2025 08:17 AM
Hi all,
We recently moved from Salesforce to ServiceNow CSM (Yokohama) and I'm rebuilding our KPI dashboard. An important KPI for us is SLA attainment in % over time (I attached a screen view of what that looked like in Salesforce).
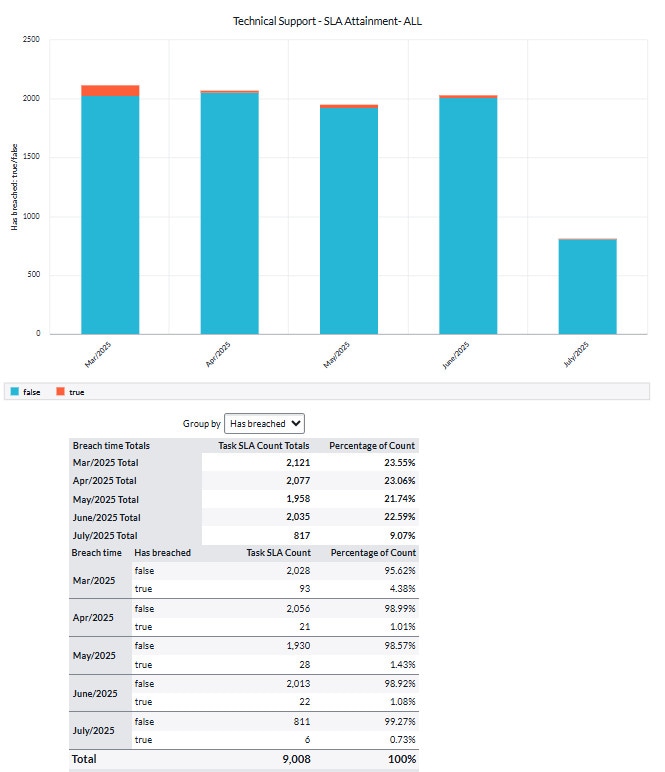
However, in ServiceNow I only manage to get the [Has breached] scores in absolute numbers (see attached). I know that you can view the percentage when you hover over the lines and also that you can display the values in a table under the graph, but it does my head in that I don't find how to visualize the actual scores in % instead of absolute numbers.
Any ideas what I'm missing?
Thanks!
Judith
- Mark as New
- Bookmark
- Subscribe
- Mute
- Subscribe to RSS Feed
- Permalink
- Report Inappropriate Content
07-12-2025 04:55 AM
Hi @jjong ,
Is the reports build through the old report builder or through platform analytics?
If my answer has helped with your question, please mark my answer as the accepted solution and give a thumbs up.
Best regards
Anders
Rising star 2024
MVP 2025
linkedIn: https://www.linkedin.com/in/andersskovbjerg/
- Mark as New
- Bookmark
- Subscribe
- Mute
- Subscribe to RSS Feed
- Permalink
- Report Inappropriate Content
07-15-2025 12:37 AM
Hi @AndersBGS , thank you for reaching out!
These reports were created in Report Builder.
Thanks,
Judith
- Mark as New
- Bookmark
- Subscribe
- Mute
- Subscribe to RSS Feed
- Permalink
- Report Inappropriate Content
07-31-2025 03:06 AM
Are you implying this is only possible in platform analytics?