- Post History
- Subscribe to RSS Feed
- Mark as New
- Mark as Read
- Bookmark
- Subscribe
- Printer Friendly Page
- Report Inappropriate Content
on 12-12-2019 03:03 PM
Using JS Code Coverage Debug Application
Please hit Like or Bookmark this article if it helps.
Scope: Server side scripts that are executed for an interactive user session only.
Common Use Cases:
- Helps Production Support Engineers to easily figure out the Root Cause of an issue.
- Helps Developers and Administrators to verify the code they developed is not accidentally touching unwanted functionality.
- Administrators and application developers can use JS Code coverage information to conduct more targeted debugging activities such as using the Script Debugger to determine why script conditions are not being met.
Can be used along with:
Introduction:
The JS Code Coverage Debug application allows administrators and application developers to log the scripts triggered during a user session and then review which lines of code the system ran [reference]. Though Session Debugger module allows us to check the list of server-side entities that are executed, it wont help us to identify the exact parts of code that has been touched during the execution. Server Scripts like Business Rules, Script Includes, Workflows etc are bread and butter to produce deliverables. sometimes it is hard to figure out if the coding changes we made are touching unwanted functionality upon execution.
Where to find JS Code Coverage:
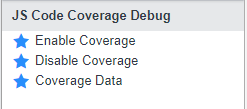
After Activating JS Code Coverage Debug Plugin (The plugin is free by the way). You can find three Modules under JS Code Coverage Debug Menu as shown in the below screenshot.

How to use JS Code Coverage: check the product documentation here.
Additional Information:
Keep in mind that every server-side execution is a Transaction. In simple words, all the CRUD operations (Create, Read, Update, Delete) are nothing but a transaction. One of the convenient ways to check all the scripts that have been triggered for a particular transaction is to do a GroupBy on Transaction Name column. As shown in the below screenshot, you can find two business rules have been triggered for a transaction with ID #24566.

From the above screenshot opening the record where Script Reference value is Business Rule: Set System Flag would look something like below

From the Product Documentation:
The color of the highlight indicates how the system evaluated the code line.
| Highlight color | Meaning |
|---|---|
| Green | This is an executable line of code that the system ran during the session. |
| Red | This is an executable line of code that the system skipped for some reason. The system may have skipped an executable line of code because the necessary script conditions were not met or because the script function was never called. You may want to use the Script Debugger to determine why the system skipped the line of executable code. |
| Gray | This is a non-executable line of code such as white space, code comment, or a portion of an expression split across multiple lines that cannot run on its own. |
Thank you,
Aman Gurram
- 1,094 Views