- Post History
- Subscribe to RSS Feed
- Mark as New
- Mark as Read
- Bookmark
- Subscribe
- Printer Friendly Page
- Report Inappropriate Content
42m ago
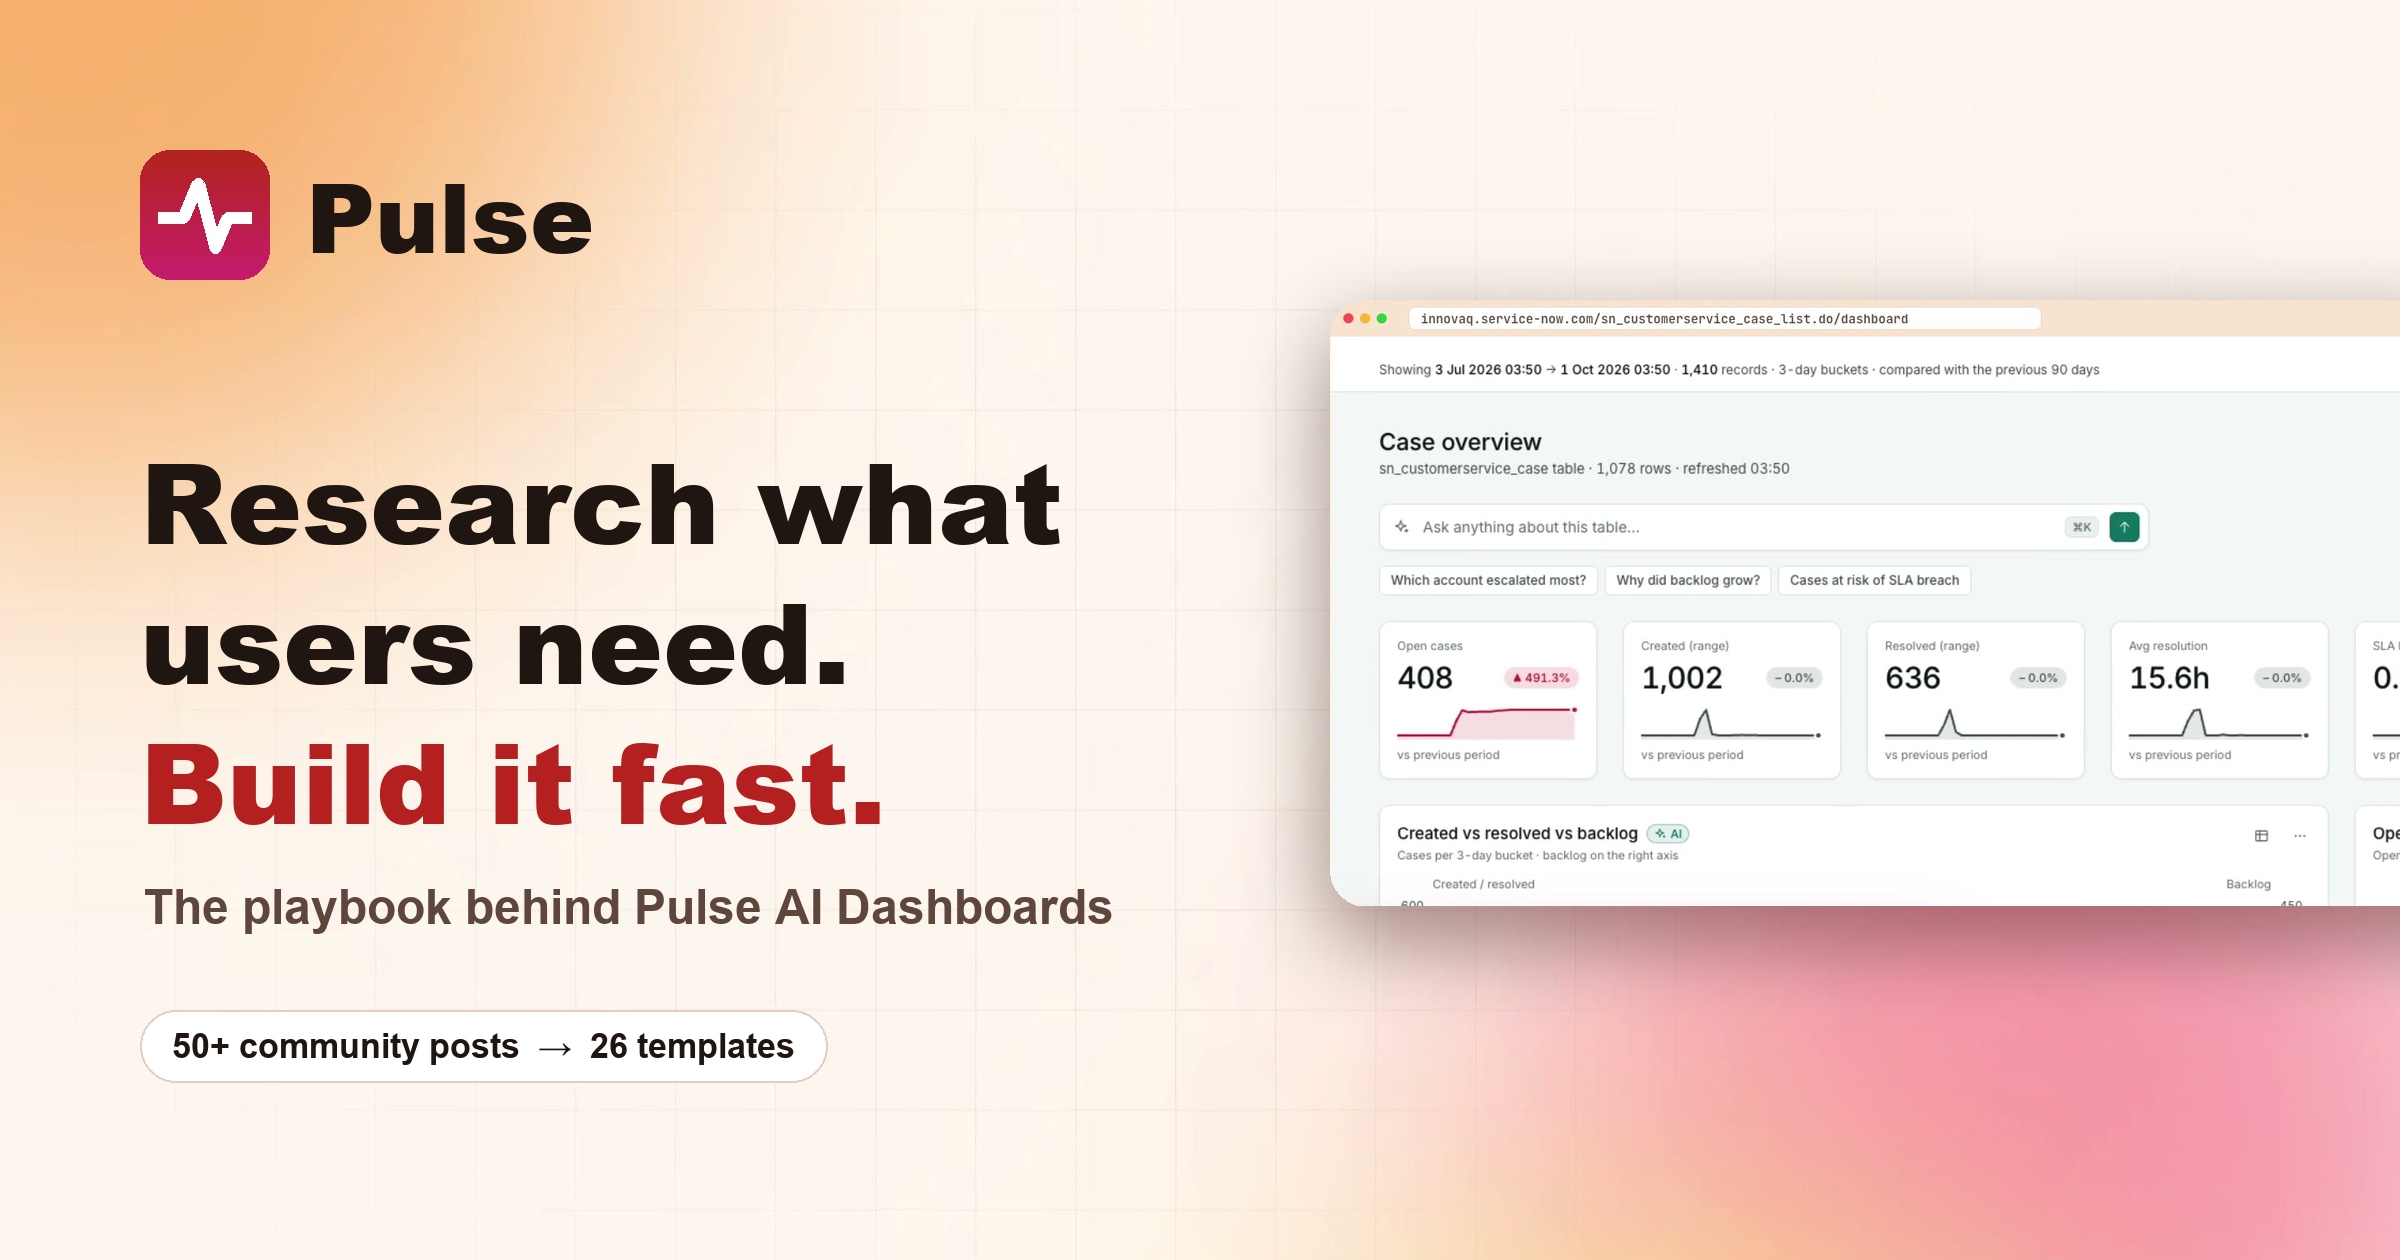
TL;DR: I didn't guess what to build. I used Claude and the open web to read what ServiceNow users were already saying. More than 50 posts and comments described the same frustration: people can't find a dashboard or view that shows what they actually need. That research became the feature list for Pulse AI Dashboards, which I built and demoed at IP Week. Here is the process, so you can reuse it.
The hardest part of building is choosing what to build
Most side projects and hackathon ideas fail before anyone writes code. They solve a problem the builder finds interesting, not one users feel every day. I wanted to start from real pain in users' own words, and only then decide what to build.
ServiceNow users are vocal. Community threads, forums and idea portals are full of people describing what slows them down. The catch is volume, because nobody can read all of it by hand. That's where AI helped.
Step 1: Let users tell you what hurts
I asked Claude to search the web for recurring ServiceNow pain points in community threads, forum questions and idea posts, and to return links. My prompt:
Search ServiceNow community forums and related discussions for recurring complaints from admins, agents and managers. Group them by theme. For each theme, list example posts with links and estimate how often it comes up. Only include posts you can link to, and quote the user's own words where possible.
One theme stood out. More than 50 posts and comments described the same problem in different words: people couldn't find a proper dashboard or a proper view for the records they cared about. The details varied, but the frustration didn't.
Step 2: Turn noise into themes
Raw complaints aren't a feature list. I had Claude cluster what it found into themes and count each one. The top themes, in users' words:
- "I can't find a dashboard for the data I care about." This was the biggest cluster, with more than 50 posts and comments.
- "Reports and dashboards take too long to build, and I have to wait for an admin."
- "My view isn't for my role." Agents, managers and executives all want different things from the same data.
Counting matters. A theme with 50 mentions is a product. A theme with 2 mentions is an anecdote.
Step 3: Turn themes into features
Next I asked Claude to propose features for each theme, with the problem each one solves and the posts that support it. That traceability kept the list honest, because every feature pointed back to real people asking for it.
Step 4: Add your own flavor
AI research gives you the consensus view, which is what anyone would build after reading the same posts. Differentiation comes from you. I added ideas from my own backlog that the research didn't surface but that I knew from experience would matter:
- Ask: users can ask questions in plain English, and the answers come from real, live queries, not model-generated numbers. I added it because I've seen how fast people stop trusting a dashboard once a number looks invented.
- AI Observability: one template shows success rate, latency, tokens and cost for every Now Assist call. Admins are increasingly asked what their AI is doing and what it costs, and nobody in the posts was asking for this yet.
Don't skip this step. The research tells you where the pain is. Your experience tells you how to solve it in a way nobody else would.
Step 5: Build fast with one approved template pattern
To move quickly without ending up with a patchwork of screens, I fixed the pattern first. Every dashboard is a template module with shared helpers, and a short rulebook keeps each one consistent. I ended up with 26 dedicated templates (incidents, cases, SLAs, CMDB, changes, problems, MID servers, logs and more). AI-designed dashboards cover everything else.
The rule that saved the most time: fix the template, never the copy. When a dashboard needed something new, I added it to the shared layer first and regenerated. Every screen stayed consistent.
Step 6: Demo early
I showed Pulse AI Dashboards at IP Week. A live demo gets sharper feedback in a few minutes than a design doc does in a week. Seeing someone add /d to a URL and watch a dashboard appear explains the idea better than any slide.
What Pulse AI Dashboards does
Add /dashboard (or /d) to the end of any list, record or classic page URL and a live dashboard opens. List filters carry over automatically.
Instant dashboards for any table
There are 26 built-in templates. Any other table, including custom ones, gets an AI-designed dashboard on first visit, which is then saved. About 386 of 400 sampled tables resolved to a good dashboard, and the other 14 were intentionally blocked. Answers Themes 1 and 2.
Three personas, same data
Agents see what needs attention, managers see trends and comparisons, and executives see headline KPIs. Answers Theme 3.
Ask
You ask questions in plain English and the answers come from live aggregate queries. Answers Theme 1.
Everyday tools
Time ranges, compare to previous period, drill-down to the filtered list, shareable links, export, wallboard mode and light and dark themes.
Safe by design
Pulse only reads your data. The AI sees the schema and aggregate figures, never raw records. With AI turned off, the core dashboards still work.
What I learned
- Check every source. AI research is a fast first pass, not the final word. I opened the linked posts to confirm they existed and said what the summary claimed, and I only kept what held up.
- Count before you commit. Frequency told me which problem was worth building for. Without it I'd have picked the theme I found most interesting.
- AI finds the average, you find the edge. The research gave me a solid baseline. My own additions made the demo memorable.
- Speed comes from constraints. One approved template pattern did more for my build speed than any clever prompt.
Try it yourself
- Pick a ServiceNow area you know well.
- Have AI gather user complaints with links, then cluster and count them.
- Verify the top sources yourself.
- Map each feature to a theme and its evidence.
- Add one idea that's yours alone.
- Build from a template and demo within a week.
The best feature ideas are already out there, posted by people waiting for someone to listen. If you try this playbook, share what you find in the comments.
Check out the full demo here: IDA0001492_Pulse AI.mp4