- Post History
- Subscribe to RSS Feed
- Mark as New
- Mark as Read
- Bookmark
- Subscribe
- Printer Friendly Page
- Report Inappropriate Content
on 04-11-2017 07:24 PM
Are you wondering what roles you need to give a user so they are able to see or do something in ServiceNow?
Session debugging is a feature that allows you to turn on debugging output directly on the ServiceNow UI to solve exactly these kind of problems. It only applies to your user so you don't have to worry about impacting other users. You can also run session debugging while impersonating another user (Impersonate users to debug ACLs) - which makes it a handy tool for admins who are trying to understand why their user is experiencing an unexpected issue with access controls. The Debug Security feature of session debugging outputs information about if a user has access to view, create, update or delete a given record or a given table. The feature has undergone a couple facelifts over the year. I will be discussing the state of the feature as of the ServiceNow Istanbul release.
How to Activate Session Debug for Security ACL Debugging
You can activate session debugging for ACLs through one of two modules, either System Diagnostics > Session Debug > Debug Security or System Security > Debugging > Debug Security Rules. For all intents and purposes, the two modules do the same thing.

If you look inside the modules by clicking the pencil icon, you will see they have Link Type set to "Script (from Arguments)" and the Arguments field looks like this:
GlideSessionDebug.enable("security");
GlideSessionDebug.enable("security_grant");
GlideSessionDebug.enable("security_refuse");
So, if you wanted to, you could activate session debug by script. I have no idea why you would want to do that but there it is. Anyways, let's get on the good stuff:
The Good Stuff
Once you activate Session Debugging, the output will display on the bottom of the screen. One important thing to understand is that it only outputs after your last full page load. A full page load would be when you open up the Incident form or when you open a popup window using the magnifying glass. Things that would NOT be full page loads would include modal popup windows like when you hover over a Reference Clickthrough Icon or use the Content Menu. The debug information for NON full page activities collects in the background and outputs on your next full page reload. There will be a message in the debug output that indicates it came from a previous transaction, like this:

This is true regardless of whether or not the next full page reload is in the same tab or not. One trick I like to do is to have two tabs open, one that I am testing a non-full page activity and one that I refresh to see the output of the Security Debug. I use the URL /ui_page.do to see the output because it will render the Security Debug information but nothing else.
https://yourinstance.service-now.com/ui_page.do
So what does all that gibberish mean in the debug output?
Let's look at one example and break it down:

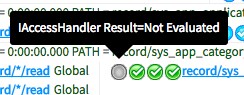
- The first part is probably pretty obvious, "18:42:35.20" means that an ACL was executed at 6:42 PM - the timezone will match your user's timezone preference
- "TIME = 0:00:00.000" means this ACL took less than 1 millisecond to execute
- "PATH = <category>/<object>/<operation>" indicates the category of ACL, on what object it was executed, and what operation was attempted
- "record" means this ACL is a Record ACL rule, defined against a specific table or field (other options are "processor", "ui page", "ui" or "client_callable_script_include").
- "sys_app_category.name" indicates this was executed against the "name" field of a record in the "sys_app_category" table
- "read" means that this was a read ACL, determining who has visibility to see the record
- "CONTEXT = ___" indicates different things. Sometimes it indicates the Scope of the script that triggered the ACL and other times it will show a link directly to the record that was being viewed.
- "RC = true/false" indicates if the rule passed or failed. Also failing rules are shown in red and passing rules are shown in green.
- The bubbles with the checkboxes indicate what parts of the ACL passed or failed
- The first bubble indicates the result of any IAccessHandler against the target object (these are specialized rules for certain parts of the platform. This bubble will often be grey, indicating that there was no access handler for this object)
- The second bubble indicates the Roles condition of the ACL. In other words, did the user have the correct roles to access the record? Remember all parts of the ACL must pass to grant access. (See "Granting or Denying Access" in Access control rules)
- The third bubble indicates if the Condition field of the ACL matched the target object
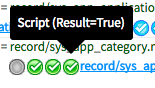
- The final bubble indicates if the Script field of the ACL matched the target object
- The first bubble indicates the result of any IAccessHandler against the target object (these are specialized rules for certain parts of the platform. This bubble will often be grey, indicating that there was no access handler for this object)
- For ACLs defined against a certain field (field level ACLs), there will be two columns of bubbles. Because of the Process order for record ACL rules, a field level ACL will not be evaluated unless table level access has first been established.
- Therefore, the first column of bubbles indicates the evaluation of table level ACLs for the given record
- Consequently, the second column of bubbles corresponds to the field level ACLs for the given record
- Therefore, the first column of bubbles indicates the evaluation of table level ACLs for the given record
- Finally, the 3 rows of grey bubbles at the bottom represent other ACLs on sys_app_category.name that were not evaluated. These do not need to be evaluated because ACLs cannot block access that has been granted by other ACLs at the same level. To improve ACL processing time we optimistically exit evaluation once one ACL at a certain level evaluates to true.


I hope this was helpful. For another article about using Security Debug, see Robert Fedoruk's (rfedoruk) great article, ACL Troubleshooting - A visual beginners' guide
- 4,845 Views
- Mark as Read
- Mark as New
- Bookmark
- Permalink
- Report Inappropriate Content
Well... that's about as thorough as listening to a George Thorogood album thoroughly while driving down the thoroughfare.
- Mark as Read
- Mark as New
- Bookmark
- Permalink
- Report Inappropriate Content
Ha ha! Bad to the Bone.