Add already created bar chart report to a catalog item custom with label variable type

- Mark as New
- Bookmark
- Subscribe
- Mute
- Subscribe to RSS Feed
- Permalink
- Report Inappropriate Content
09-15-2025 10:35 AM
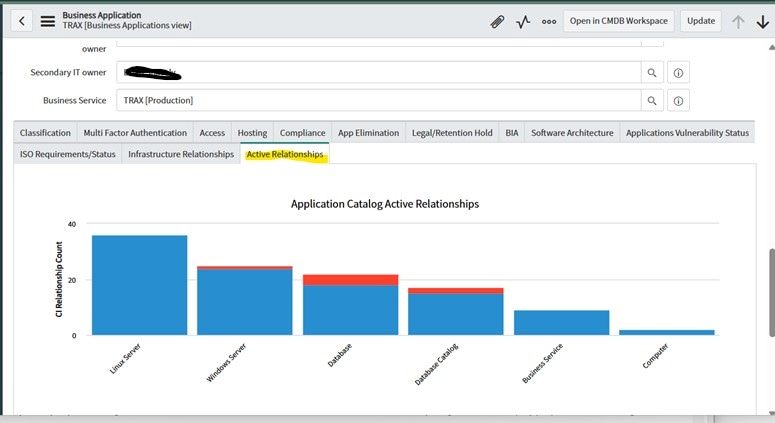
The ask is to display a dynamic bar chart report(already created and used on the cmdb_ci_business_app table) where a user can select the reference variable "business_services_to_modify" which is for the cmdb_ci_business_app table. Once that is selected, the "Tagged Asset List" custom with label variable type variable will display the report "Application Catalog Active Relationships" which is a bar chart report that shows the active relationships (cmdb_rel_ci table) on the selected Business Service. I've tried to create a widget to display this but it doesn't seem to work as no graph or data show. Any thoughts on a good way to accomplish this? I attached a screen shot of a record on the cmdb_ci_business_app table where this report/chart is currently working. They would like for this to be on a new catalog item and it's used in the Service Portal.
- Mark as New
- Bookmark
- Subscribe
- Mute
- Subscribe to RSS Feed
- Permalink
- Report Inappropriate Content
09-15-2025 10:57 AM
Hi @booher04 ,
To display the dynamic bar chart in your catalog item:
The OOTB report widget won’t work directly since it only renders a static report by sys_id.
You need to make it dynamic:
Option 1 (Reuse existing report): Call the Report Data API (/api/now/report/{report_sysid}) and pass a sysparm_query that filters on the selected Business Service (business_services_to_modify). Then render the returned chart JSON in your widget.
Option 2 (Custom chart): Query the cmdb_rel_ci table directly in the widget (GlideAggregate) using the selected Business Service, and render results with Chart.js.
✅ Either way, you’re feeding the user’s variable into the chart dynamically, instead of embedding the static report.
- Mark as New
- Bookmark
- Subscribe
- Mute
- Subscribe to RSS Feed
- Permalink
- Report Inappropriate Content
09-17-2025 04:29 AM
I was able to get it to start rending some data but I can't quite get it to render like the chart on the cmdb_ci_business_app form. The chart I want to show is an embedded chart for a bar report. Can't seem to get the correct data.
Here's the Portal view inside the variable:

Here's the chart I want to show: