- Mark as New
- Bookmark
- Subscribe
- Mute
- Subscribe to RSS Feed
- Permalink
- Report Inappropriate Content
12-25-2014 06:29 PM
Hi community,
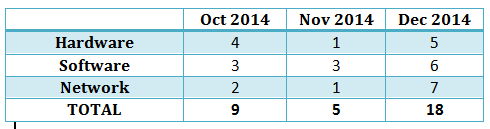
Has anyone create report of Incident Category by Month in a Pivot Table format such as followed?:

I cannot seems to find the right field to group it by months. Anyone has any ideas?
Thank you.
Solved! Go to Solution.
- Labels:
-
Analytics and Reports
- Mark as New
- Bookmark
- Subscribe
- Mute
- Subscribe to RSS Feed
- Permalink
- Report Inappropriate Content
12-26-2014 12:33 PM
Hi Alex,
As indicated by Anurag, pivot table reports only allow you to work with existing fields which means the whole date-time. That gives you a couple options in order of increasing difficulty:
- Use a Trend Chart as indicated by Anurag
- Create a month field and a business rule to populate it, you can make it readonly and not even show it on the form
- Create a custom report using a UI Page/UI Macro and GlideAggregate
- Mark as New
- Bookmark
- Subscribe
- Mute
- Subscribe to RSS Feed
- Permalink
- Report Inappropriate Content
04-25-2018 02:57 PM
Hi Alex
I am new can you please tell me were to create this month field and what business rule to use I need a monthly report for Incidents and RITMs open and closed/Resolved tickets
I would very much appreciate you help
- Mark as New
- Bookmark
- Subscribe
- Mute
- Subscribe to RSS Feed
- Permalink
- Report Inappropriate Content
04-25-2018 02:58 PM
Hi Alex
I am new can you please tell me were to create this month field and what business rule to use I need a monthly report for Incidents and RITMs open and closed/Resolved tickets
I would very much appreciate you help
- Mark as New
- Bookmark
- Subscribe
- Mute
- Subscribe to RSS Feed
- Permalink
- Report Inappropriate Content
01-03-2019 05:00 AM

- Mark as New
- Bookmark
- Subscribe
- Mute
- Subscribe to RSS Feed
- Permalink
- Report Inappropriate Content
12-29-2014 12:24 AM
Hi all,
Thank you for your replies. I did saw the trend chart. Just wonder if I could do it in pivot table type of reporting with additional fields since the trend chart only allow limited column to be displayed. I am trying not to look at any third party software that could incur additional costing for now.
Guess all I could do is going into scripting in UI Macro or business rule again and test on error. It's unfortunate that, the platform does not has this kind of reports from OOB.
- Mark as New
- Bookmark
- Subscribe
- Mute
- Subscribe to RSS Feed
- Permalink
- Report Inappropriate Content
03-29-2018 03:49 PM
We really need an alternative solution for reporting with date fields. Is there any chance of getting a pivot table report option as a 'trend' report? I have a requirement to report on Releases by Planned Release Date and Further broken down by Application. I can use a column chart to represent it visually, but what my user base really wants to see is the lower part of the Grid if you do Display Grid - which is a pivot table. If I could only display just the Grid and not the columns, I would have what I need. Are there any plans to provide such an option?