


shaunmillin

ServiceNow Employee
Options
- Subscribe to RSS Feed
- Mark as New
- Mark as Read
- Bookmark
- Subscribe
- Printer Friendly Page
- Report Inappropriate Content
06-14-2016
07:54 AM
In this blog we are going to cover how to get your data into the Orchestration ROI Plugin.
What is Orchestration ROI? Orchestration ROI maybe one of the coolest automation ROI calculators I have ever played with. This tool helps on two major fronts when it comes to automation. Orchestration ROI will allow you to easily find where the biggest bang for your buck is, and will also easily allow you to track how much money you have saved with automation after you have created your workflow.
Link to Orchestration ROI Documentation https://docs.servicenow.com/bundle/geneva-it-operations-management/page/product/orchestration/concep...
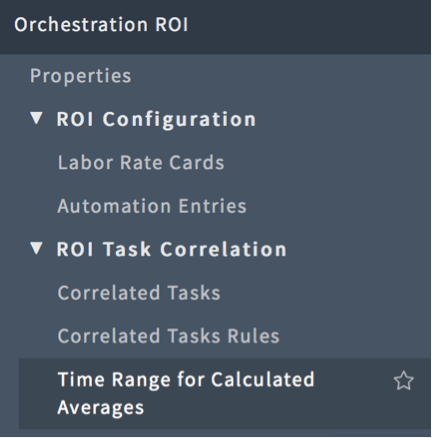
First, open the Orchestration ROI tool.
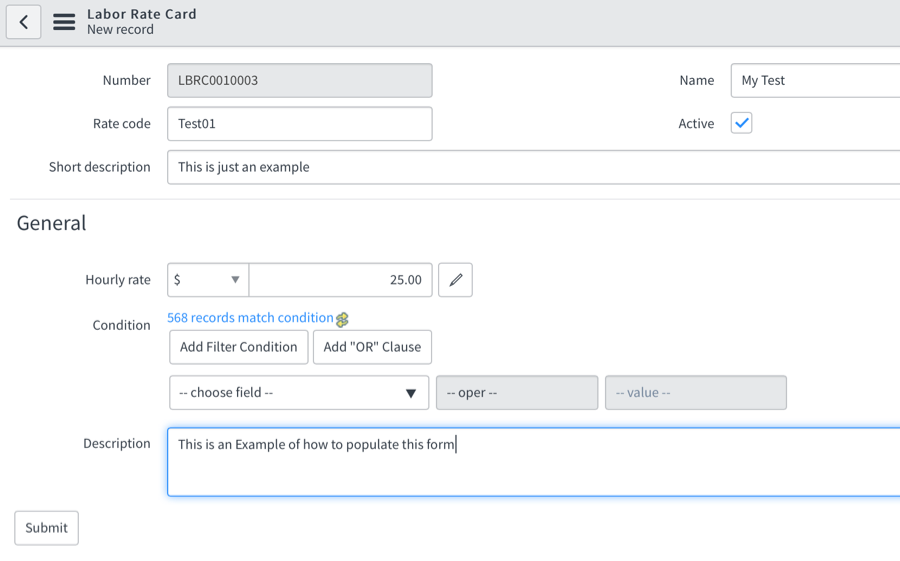
Select Labor Rate Cards. A labor rate card is a generic way to indicate a type of employee and what that type of employee makes an hour on average.
Click New
Fill in the Form. Rate Code is just a custom abbreviation to create for the record.
Click Submit
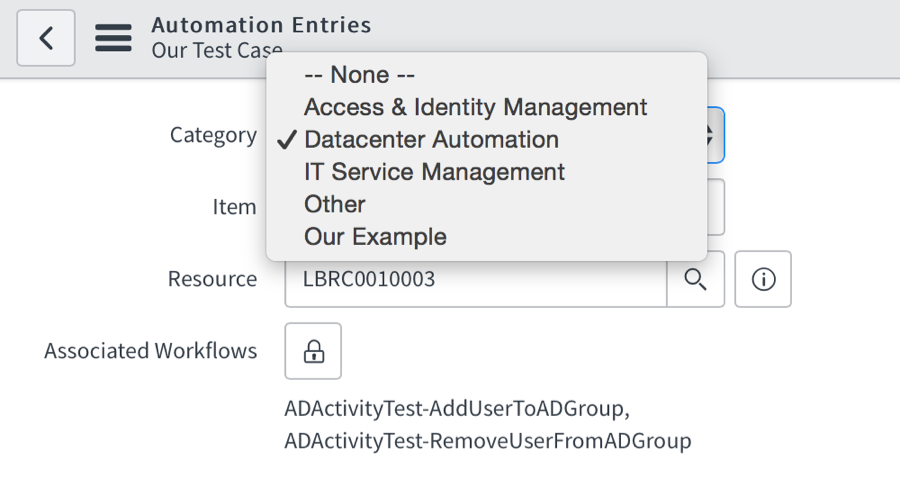
Next we need to create an Automation Entry
Click on Automation Entries
Click New
Category is a drop down list. If you need to add additional Categories to this list we will cover that next.
Item is the name of this Automation Entry
Resource is the labor rate card we created earlier.
Associated Workflows is a way to track how much money is being saved because it tracks every time this workflow was run on this item. This field allows for multiple workflows to be selected per task.
Estimated Duration is a guess you can make on how long this task takes to complete manually
Estimated Volume is a guess you can make on how many times this task is performed each month.
To have the system us real incidents from your system we can create Correlated task rules.
Click Submit.
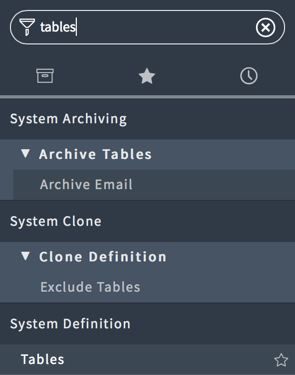
To add items to the category list of an Automation Entry go to tables.
And open this table automation_entry_form.
Scroll down to columns and select Category
Scroll Down to Choices.
Click New
For Label and Value put in what you want the name of this Category to be.
For Sequence put in a numeric value for the order you want this value to be displayed.
Click Submit
Navigate back to the Automation Entry you created and validate that the new value shows up as a category on the drop down.
Next We need to create a Correlated Task Rule

Click New
Automation Entry is an automation entry like the one we just created.
Table is the table for this rule to query from. I selected incidents but any table maybe used.
Condition is the query used to match items from this table to this Automation Entry For this example I chose to use Subcategory is Password reset.
Click Submit AND process now.
Just repeat adding correlated Rules for each item you want to be correlated to this Automation Entry.
The next thing to cover is how to get the system to calculate your real incidents to the Automation Entry.
Navigate back to the Automation Entry we created.
If this section of the Automation Entry is blank there were no incidents that matched your criteria, or you need to extend the time frame for the calculation to use. To extend this time range go to Time Range for Calculated Averages.

Here change the date ranges to a range that will have results and click calculate.
Note: This may take some time to process depending on how far back you went.
Once you have clicked on calculate you may need to navigate to the scheduled job called Processing ROI Schedule. Once in this Job simply tell it to execute now.
If you need to generate any custom reports from Orchestrator ROI you can use the current reports as templates here is a list of the report names.
- Time Spent by Task Category
- Volume of Manual Tasks per Month by Category
- Projected Hours Spent Monthly by Category (Uses Calculated Duration & Volume)
- Projected Monthly Expense by Category (Uses Calculated Duration & Volume)
- Projected Hours Spent Quarterly by Category (Uses Calculated Duration & Volume)
- Projected Quarterly Expense by Category (Uses Calculated Duration & Volume)
- Projected Hours Spent Annually by Category (Uses Calculated Duration & Volume)
- Projected Annual Expense by Category (Uses Calculated Duration & Volume)
Lastly, if you have Performance Analytics and have installed the Orchestration ROI Premium we need to enable the scheduled job for that. Navigate to Performance Analytics > Data Collector > Jobs. And find the job called [PA ROI] Historic Data Collection open this and click the checkbox for Active.
As always happy automating!
- 3,110 Views
You must be a registered user to add a comment. If you've already registered, sign in. Otherwise, register and sign in.

