


Simon White1

ServiceNow Employee
Options
- Subscribe to RSS Feed
- Mark as New
- Mark as Read
- Bookmark
- Subscribe
- Printer Friendly Page
- Report Inappropriate Content
09-28-2016
09:54 PM
In the last blog article, I talked about the need to tailor business service monitoring dashboards to cater for the specific needs of your audience. People want to see meaningful information depicted in an easily consumed format. The dashboard needs to immediately convey information about the severity, affected users and business criticality of an alert. Globally dispersed organizations also need to assess the health of applications servicing users in different geographies. Maps are a good way to do this.
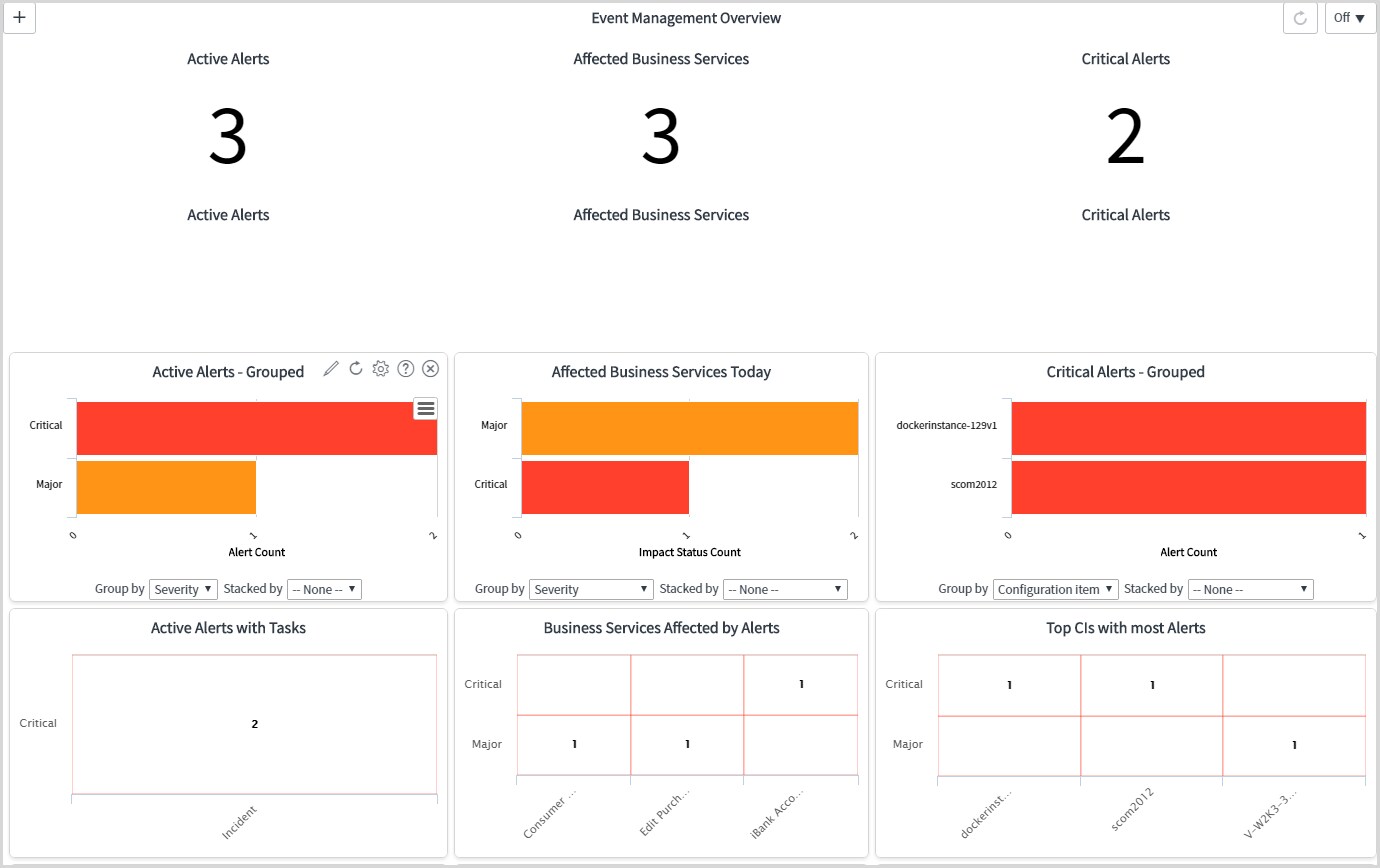
The default Event Management Alert Overview dashboard summarizes those IT alerts currently impacting service delivery. It displays information about severity, affected CIs and services.
The dashboard is very flexible, allowing you to alter existing content or add your own. You can also create your own dashboards, tailored for different audiences — presenting the specific information and chart types relevant to them.
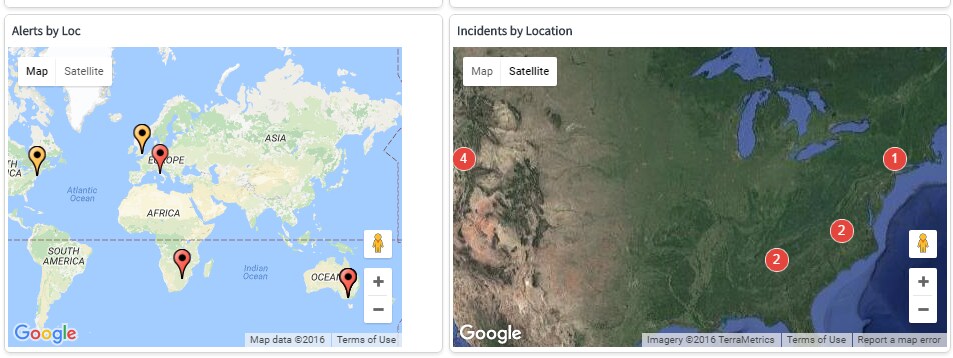
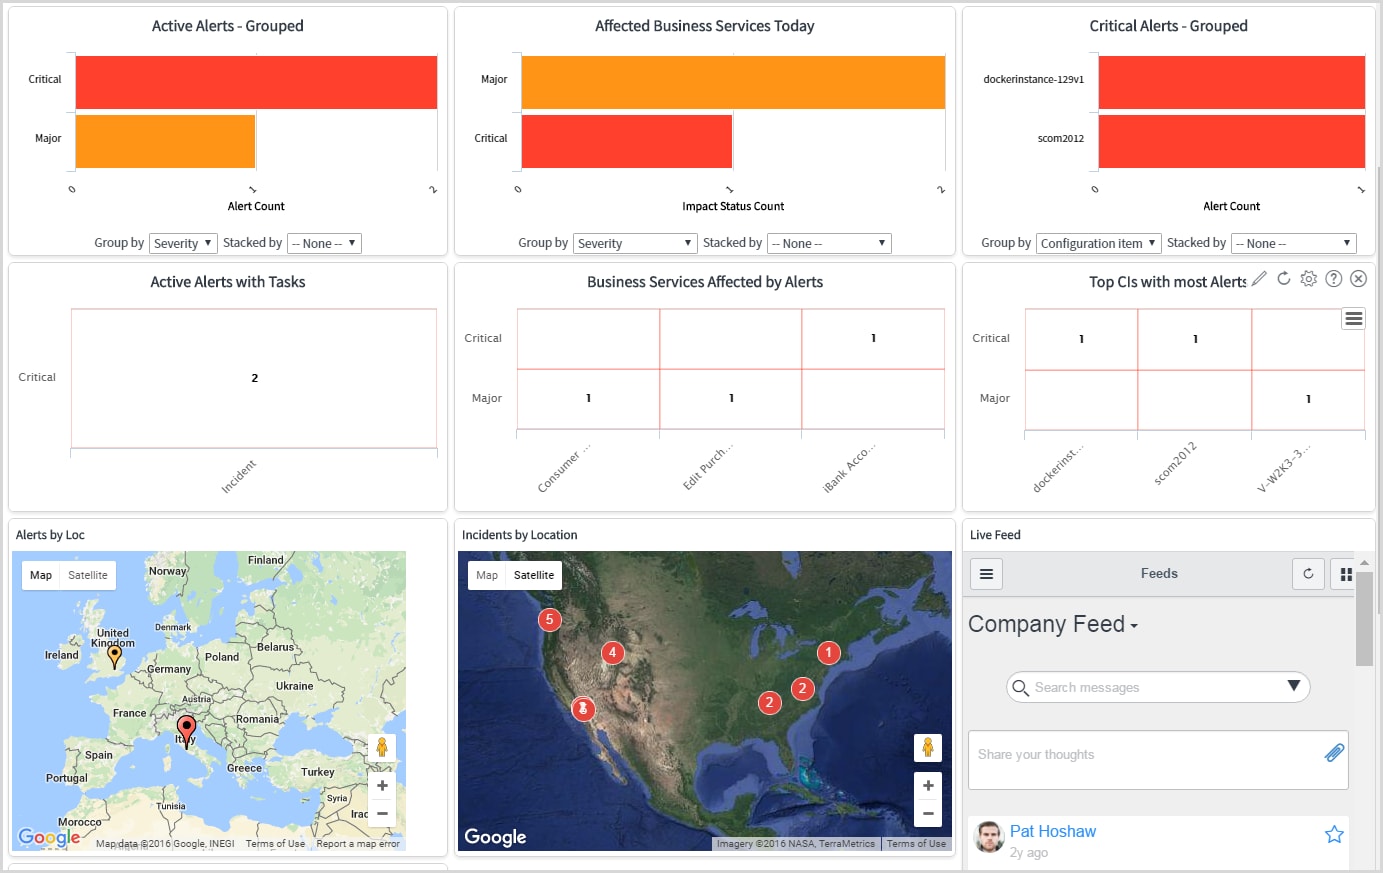
The screenshot below shows some maps added to the existing event overview dashboard. The map on the left depicts Alerts by Location — i.e. which user groups or data-centers are experiencing issues. The one on the right summarizes the number of open incidents by location (which may or may not have come from alerts).
Note that the right-hand map includes counters on the map — not just static icons. Icon size and color can also be varied. These are beneficial capabilities to make sure that we can present useful information "at a glance" and enable the viewer to quickly identify hot-spots and prioritize triage efforts.
One of the design goals of ServiceNow's event management solution was to simplify maintenance of dashboards and automate wherever possible. Gone are the days of manually dragging and dropping icons to create business service views. After defining which metrics will be shown on a dashboard, the content will be dynamically maintained and updated. Automatic refresh can also be activated.
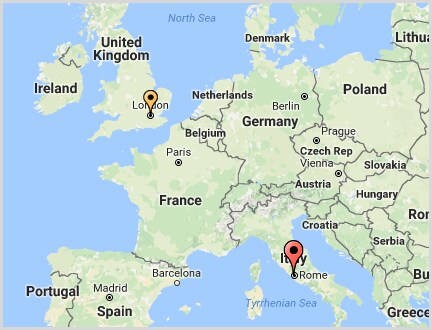
This design principle also applies to maps — once created, their content will be automatically updated. Icons will be places on their geographically correct location using latitude and longitude coordinates — if they exist. This implies that you need to make sure CIs are defined with their correct location (e.g. city) which correlates with defined coordinates. The Locations table holds these city locations.
Following are the steps to create a map widget for use on Event Management's dashboards:
- Create the Map Page describing the content and map icons:
- Navigate to System UI > Map Pages
- Create a new Map Page record (e.g. All Alerts) with the following attributes:
- Controls size = Small
- Type = Normal
- Center map on = the location which you want the map centered on when displayed
- Initial zoom = 2 or 3 depending on how much detail you want to show on the map
Feel free to experiment with some of the settings to alter the map visualization. - In the Map Page record, you need to include some script logic to define the data source, icon, size, color and (optionally) variable content. The Helsinki documentation includes some examples to get you started. These display Google map-file icons. You can review the available icons here.
Below is an example script which displays an alert icon over the city hosting the CI currently experiencing an alert. Only Critical and Major alerts are shown and the CI must not be under maintenance. Note that the icon size is made larger for critical alerts. The documentation also shows how to dynamically built a URL link so that when the user clicks on an icon it will direct them to the appropriate page (e.g. to analyze the alert).
- Update the Alert Overview dashboard to include the map:
- Now that you've created the map display and icon placement logic you can add a widget to the map.
Navigate to the Event Management Overview dashboard. - Use the + icon in the top left of the dashboard to add your own content.
Choose the iFrame widget and the location you want the content placed. - Drag the widget to the appropriate column and location on the dashboard.
- Edit the new widget and define the following properties:
- Sizing = Fixed
- Height & Width = as appropriate (I use 300 and 500 respectively)
- URL = /map_page.do?sysparm_name=All%20Alerts where the name matches the Map Page record
created earlier. - Save and test the new content.
- Now that you've created the map display and icon placement logic you can add a widget to the map.
- Optionally, you can create your own dashboards (homepages) from scratch.
- Navigate to Homepage Admin > Pages which is the portal pages editor.
- Create a new record with a name reflecting the type of dashboard.
Save it and use the View Homepage link to edit the layout and content. - Change the layout to reflect the dashboard view you want.
- Use the same instructions from section 2 above to create the widget on the dashboard.
Arrange the content including sizing to suit the user's screen.
Following is an example of an event dashboard comprising only map views. It is an option often used for display on a wall panel in a Network Operations Center.
The ServiceNow Event Management solution continues to gain traction with IT organizations looking for consolidated business service management across their enterprises. The ability to customize dashboards to present information tailored to their different roles and needs is paramount. The map-based view discussed in this blog is one valuable tool in achieving this goal.
If you'd like to learn more about ServiceNow's Event Management capabilities, please see the Learning Library here.
Labels:
- 4,194 Views
1 Comment
You must be a registered user to add a comment. If you've already registered, sign in. Otherwise, register and sign in.

