


Bill Tang

ServiceNow Employee
Options
- Subscribe to RSS Feed
- Mark as New
- Mark as Read
- Bookmark
- Subscribe
- Printer Friendly Page
- Report Inappropriate Content
11-12-2017
08:44 PM
I found the feature 'Report ranges' very powerful but it was rarely used or even discussed in our user community.
Consider this use case:
I want to create a single report for my incidents to understand:
How many incidents were created in each week in the last 60 days;
and
In each week, I want to see 2 groups of incidents:
1 - How many incidents are still in the operational state(new, work in progress, waiting for problem etc.) and
2 - How many incidents are no longer operational(state in resolved, closed etc.)
If you take a minute to think about the requirements of this report, you will realized that it is not easy given what is available from ServiceNow out-of-the-box reporting tools. Essentially, what we need is the capability to performance advanced grouping of our data into a few customized groups based on the 'incident.state' value. Then we can take advantage of the weekly trend feature provided in the 'Time series' reports. The final result should be similar to this:
Follow these simple steps to make this report:
Step 1: Define the groups of 'incident.state' value
Open Reports > Administration > Report Ranges and create a new report range like this example:
Create another range for state value 6 and 7.
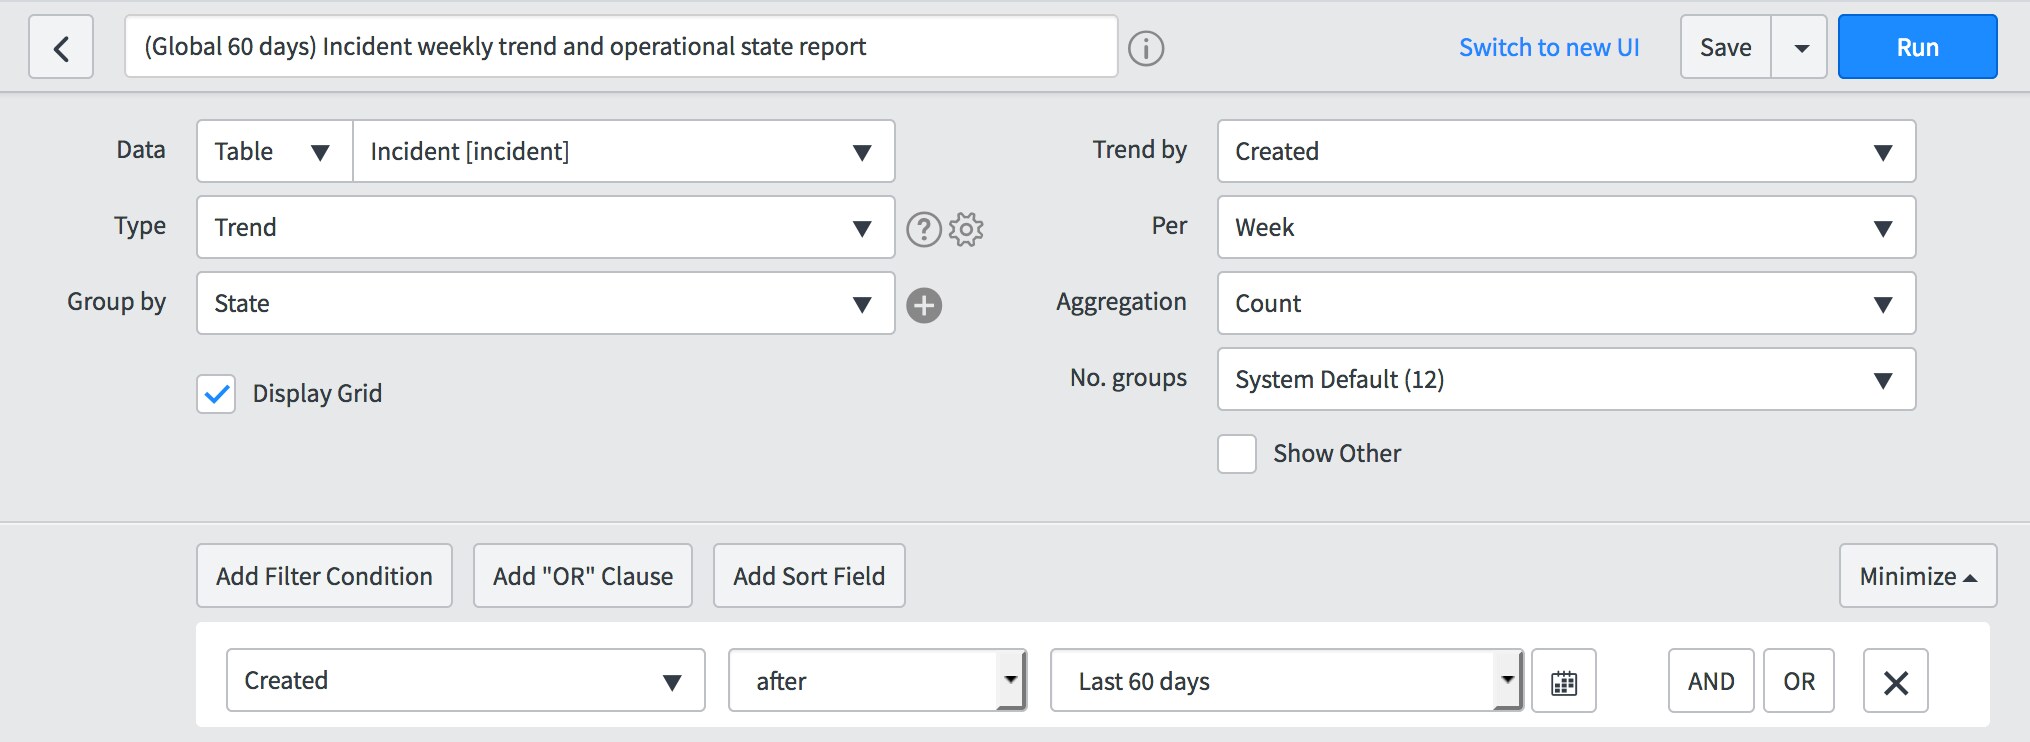
Step 2: Create the report
Select "Time Series > Trend" report, and then setup the filters like this one:
The use of this feature can be extended to 3 types of field values: Date/Time(some out-of-the-box ranges are provided), Lists and Integer.
More details can be found in the Docs
Happy reporting!
Labels:
- 12,083 Views
4 Comments
You must be a registered user to add a comment. If you've already registered, sign in. Otherwise, register and sign in.

