- Post History
- Subscribe to RSS Feed
- Mark as New
- Mark as Read
- Bookmark
- Subscribe
- Printer Friendly Page
- Report Inappropriate Content
on
04-06-2020
08:35 AM
- edited on
10-25-2022
03:09 PM
by
ChrisSteinke2
![]()
You're sold on using Predictive Intelligence to route work more efficiently, help drive faster resolution, and recommend major incidents before they become a serious problem. AWESOME! Then, you run your first classification, similarity, or cluster solution definition and the results aren’t what you expected. What do you do? Part 1 of this article will break down some of the most common tuning patterns we see in the field for classification. Part 2 will provide similar tuning recommendations for similarity and clustering.
Classification is used to auto-populate fields on case/incident forms to assist in intelligent routing to the most efficient assignment group. Just to be clear, machine learning will never be 100% right (aka precise) all the time. The goal is for the machine learning model to be right more than their human counterparts. Using real world data, classification models with a precision higher than 70% and coverage higher than 80% are typically more effective than agents looking at thousands of incidents/cases per month.
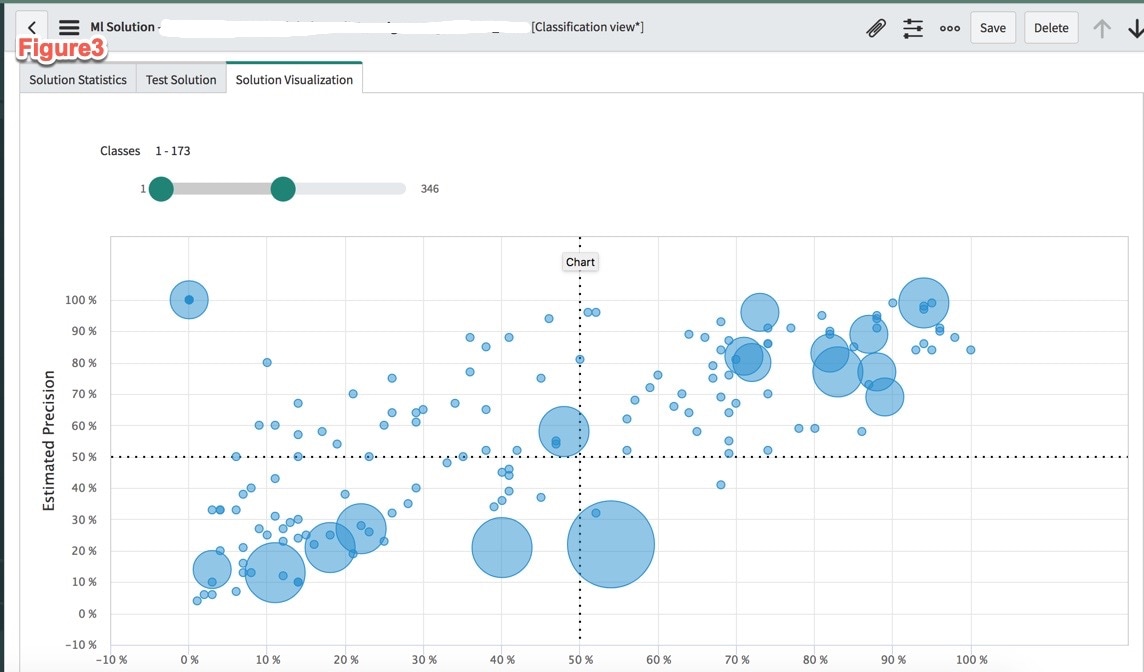
Figure1 represents a good classification model. The blue circles represent our assignments groups, the larger the circle the greater the distribution. What's distribution? Let's look at the blue bubble "Deskside Support". This assignment group represents 22% of the incidents from the training set. What makes this a good model is that all the blue bubbles which represents assignments groups are in the upper far right quadrant. Which means they have good precision and good coverage. Note: the x-axis changes to “recall” in Orlando. (This is a big picture you may need to scroll right.)

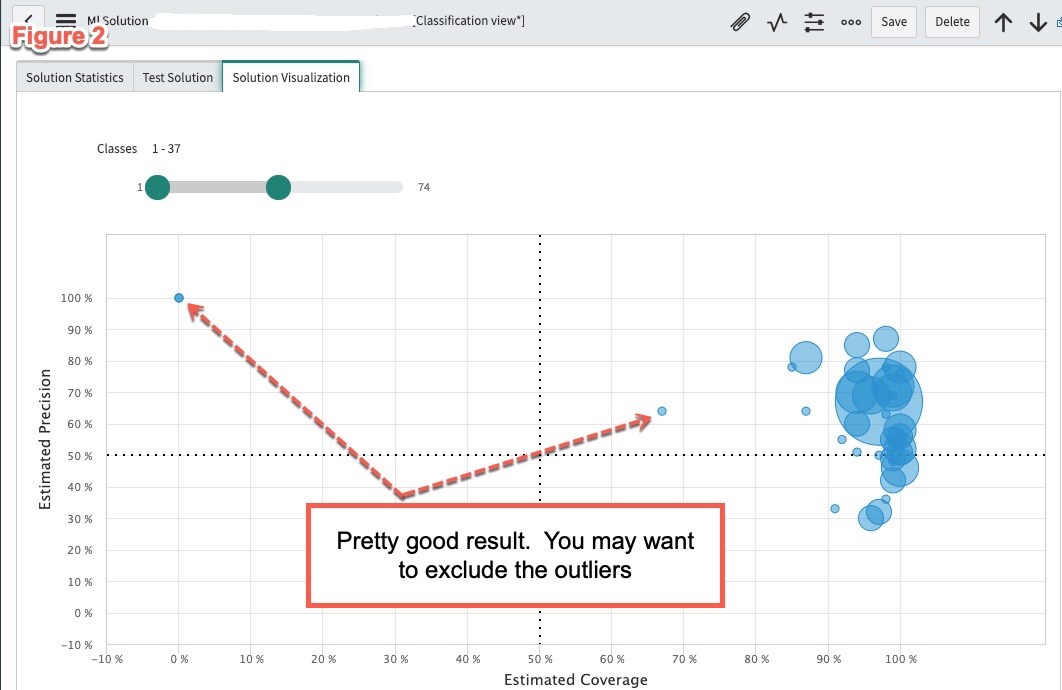
In Figure2 we notice that there are a couple of outliers that are not in the far upper right quadrant. Those are assignment groups that could be excluded from the model as they have a very little distribution and are most likely rare cases where a human is required to determine when an incident goes to that assignment group. Our Predictive Intelligence documentation lists out the steps on how to exclude classes from the model.

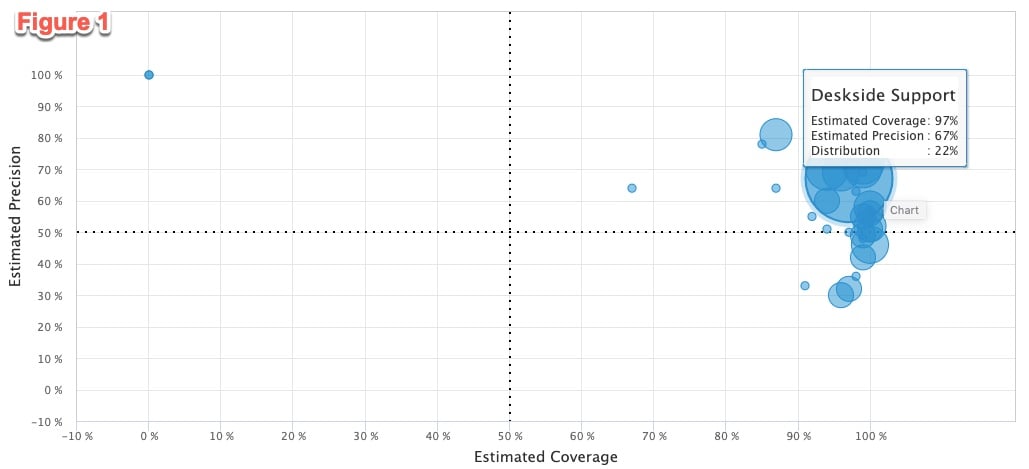
Below Figure3 represents a model that needs a lot of work. You’ll notice many of the assignment group bubbles with large distributions are scattered all over the classification graph, with several in the low precision and low coverage sections.

So how do you move all those assignment group bubbles to move to the upper right, like our ideal model in Figure1?
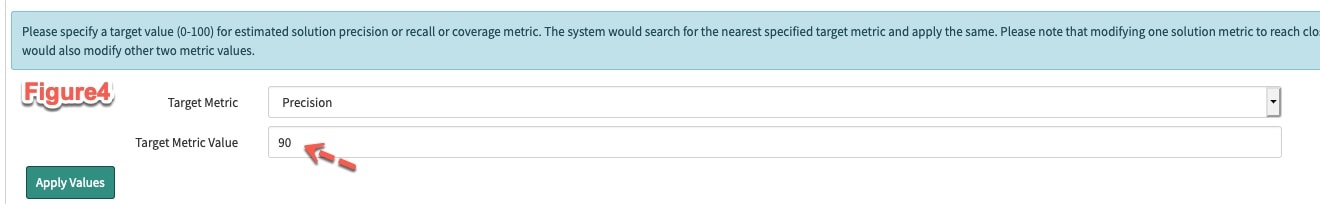
Starting in Orlando, we have the ability to set the target precision and coverage for a solution definition. For most customer, setting a target solution level precision should be the first step when they start using predictive intelligence. By setting the target level precision, predictive intelligence will automatically change recall and coverage values to get all classes close to the target precision of 90% (see Figure4).

What if target metrics aren’t helping? I’ve listed a few approaches that can help you move the model to a more ideal state below.
Techniques to improve the classification model precision & coverage:
- Understand the quality of the data. If there are lots of assignment groups that mean the same thing with different spellings or if there are empty/null assignment groups this will impact the precision of model. You’ll want to either exclude those from the training set or clean up your data.
- “More is not always better”. Sometimes training using 200k records vs a smaller selection of 80k records from the past 3 months may drive down precision & coverage. If your precision is low try training with a smaller data set first (i.e. 30k records), increase the number of records to see if that increases the precision. In some cases, 200k records may reduce precision because there is a chance for more bad data in that training set.
- Make sure there is good distribution of the assignment groups. If 90% of the incidents are skewed toward “Deskside Support” then you don’t need a machine learning model to tell you where new incidents will land. Also, you don’t want to use inputs with lost of unique values. For example configuration item, which may have millions or more records may make it harder for the machine learning algorithm to predict if you us CI as an input field.
- Look at individual class level settings and see if a higher precision can be selected for that class.
- If you started with the OOTB classification solution definition and it’s giving a low precision/coverage then try analyzing the incident/case data to determine what other inputs may help the ML predict a more precise result. Running lists/reports with these different input combinations should shed light on whether additional inputs such as category, subcategory, or location might help improve the precision/coverage of the model.
- Simplify your model. Because predictive intelligence is easy to configure many customers will add lots of inputs to the solution definition without understanding that “more is not better”. If you have lots of inputs and your model has low precision/coverage, then strip out all the inputs and start again with just short description. Update and retrain and then add input #2 and so forth until you get the desired precision.
- You might not be able to predict assignment group with just one model. So, plan to use multiple models. One model may not be able to predict all the assignment groups. You can call different solutions definitions in multiple passes. In Figure3, I used four classification models to predict the assignment group.
- Finally use Performance Analytics(PA) with Predictive Intelligence. PA has helpful OOTB indicators such as re-assignment count that can help identify areas where you want to focus Predictive Intelligence.
If you’d like to learn more about how to interpret and tune similarity and clustering models make sure to check back on the Analytics, Intelligence, and Reporting Community.
Thanks for reading. Stay health and safe!
- 42,773 Views
- Mark as Read
- Mark as New
- Bookmark
- Permalink
- Report Inappropriate Content
hi!
All the figures are of "Solution Visualization" tab? We're making some test and it's shows all in white, nothing showed, which could be our problem? Non-prod instance? not enough incidents tested?
thanks.
- Mark as Read
- Mark as New
- Bookmark
- Permalink
- Report Inappropriate Content
Hi MA, yes all the figures are in the "Solution Visualization Tab" in application navigator > predictive intelligence > classification > solutions. I have seen the issue you described before. You need to open up a support ticket and support will address this issue on your instance so you can see the visualizations that I have in this article. Best, Lener
- Mark as Read
- Mark as New
- Bookmark
- Permalink
- Report Inappropriate Content
Nice article! Looking forward to the next similarity part!
- Mark as Read
- Mark as New
- Bookmark
- Permalink
- Report Inappropriate Content
Hi,
Gr8 insights on Orlando PI.
I would like to know, whether PI can either be configured and/or programmed to plan a set of actions for a given classification of ticket (let us say "reset a password" that has high precision and coverage)?
Further whether the SNOW Orchestrator be configured to the above mentioned plan of actions to trigger a BOT (a python script to read the db for userid credentials) for action step #1, wait for Human role to do the job (if applicable for approval for example) for action step #2 and trigger another BOT (python script to reset the password) as action step #3 and send email to requestor as action step #4.
Thanks.
- Mark as Read
- Mark as New
- Bookmark
- Permalink
- Report Inappropriate Content
thanks CM_X. Your comment reminded me of a quick tip for those who are already working with Similarity. One thing that I find that is not obvious is "setting and saving the similarity threshold". Go into application navigator > predictive intelligence > similarity > solutions > select your trained solution. If you test your similarity solution and it says "below threshold" try changing and saving the similarity threshold.

- Mark as Read
- Mark as New
- Bookmark
- Permalink
- Report Inappropriate Content
Hi Venkat,
Really interesting question. I'll comment from the perspective of the ServiceNow platform, which is extremely flexible as it uses JavaScript as it's core programming language. Classification in ServiceNow is used to auto-populate mandatory fields found in an incident/case form. For example to create an incident you would fill in short description = "Reset a Password" and then the ML would fill in the category, subcategory, and assignment group fields necessary to route that incident to the right place for resolution. Let's say "reset a password" sends it to the "Identify and Access Management" assignment group. We would then leverage ServiceNow to drive the action. Virtual Agent chat bot, business rules, UI actions, and workflow immediately come to mind as vehicles of action as they can access the trained ML models via the ML APIs.
If we approach this from ServiceNow Virtual Agent chat bot, the NLU would take the users input "Reset a Password" and direct it the appropriate conversation workflow for self-resolution, if we can't resolve from Virtual Agent it would create a ticket and predict the assignment group for appropriate routing.
If we are trying to drive action from the prediction on an incident form we might be able to leverage of UI Actions (JavaScript), business rules (on insert/update), or workflow to take action.
That's a mouthful, so I'll end with a couple of links that might be helpful for you to dig into your question.
Best Regards, Lener
- Mark as Read
- Mark as New
- Bookmark
- Permalink
- Report Inappropriate Content
Hi all,
Regarding the prediction of different fields, we have categories and then different subcategories depending on the category value. This dependency is taken into account when you open an incident on portal / backend, but when predicted (through different ML solutions) we found on testing some incoherent values are written, for exemple a subcategory value non concordant on category value given, is there a way of considering those cases?
thanks.
- Mark as Read
- Mark as New
- Bookmark
- Permalink
- Report Inappropriate Content
Hi Lener,
Thank you for kind response. Apologies for my delayed reply.
As the days pass, I'm getting more deeper into SNOW features, and hence I could able to understand what you wrote. It all makes sense to me now. I once again thank you for taking time and responding to my query.
Now, I'm trying to learn Predictive Intelligence module. Please share link from ServiceNow sites, that points to the above.
Stay Home. Stay Safe.
Thank you.
Venkat
- Mark as Read
- Mark as New
- Bookmark
- Permalink
- Report Inappropriate Content
Hi MA,
What does your solution definitions process look like?
Are you trying to predict category using a subcategory and short description as input? Or are you trying to predict subcategory first from short description and then using the predict subcategory as input into your solution definition that predicts category?
- Mark as Read
- Mark as New
- Bookmark
- Permalink
- Report Inappropriate Content
Hi Venkat, we're close to releasing a comprehensive On-Demand Predictive Intelligence Lab. for customer training. We're targeting between May and June timeframe.
- Mark as Read
- Mark as New
- Bookmark
- Permalink
- Report Inappropriate Content
Venkat, I forgot to mention we do have Fundamental Predictive Intelligence training on NOW Learning that you can leverage today. Best Lener
Predictive Intelligence Fundamentals:
https://nowlearning.service-now.com/lxp?id=overview&sys_id=5333bc931bebc4506d6c7550cd4bcb70&type=course
- Mark as Read
- Mark as New
- Bookmark
- Permalink
- Report Inappropriate Content
Hi Lener,
We are using, always, like input, the Description field (max length 4000) for every solution because Short description didn't give us confidence enough.
On Incident form we have Category A, B... X, when are selected, depends on, it allows you to select subcategory A1, A2... B1, B2... X1, X2, according to category selected, ok? It works when creating through form on backend.
But in Portal, the user simply writes Description, and then, though PI, we try to insert other fields. When a Solution is active for Category and another for Subcategory, we found that were created some combinations like A-B2, B-A3.. not allowed in the form. That's a problem, the solutions are completely independent, not considering customization done previously.
I'll expect better explain for everybody comprenhension.
By the way, on testing our solution looks like mostly like figure 3 😞
Bye.
- Mark as Read
- Mark as New
- Bookmark
- Permalink
- Report Inappropriate Content
Hi Lener,
Thank you for pointing me to the PI learning material.
I understand the "Classification, Similarity and Clustering" solution definitions.
I started working MVP on Classification.
I tried to create a new record. I'm facing a challenge. After selecting the "table", the "output field" dropdown box is not active. It is not showing column fields to select. The rest of the attributes on the form, such as Fields, Filters all working fine. Without choosing the "Output Field", I cannot proceed for the "submit for training".
Please help.
Thanks
Venkat
- Mark as Read
- Mark as New
- Bookmark
- Permalink
- Report Inappropriate Content
Hi Lener,
I've progressed well on the PI classification. Thanks for the training material that you've shared.
I understood some of the following through my heavy labor and experience.
* Solution Definition do not access records more than 300K.
* A minimum of 10K records needed for one outcome value. For example, for the Category outcome, if there are 3 fields such as Software, Network, Database, then a minimum of 3x10k = 30k records are needed for the Training Solution.
* Recall parameter becomes more meaningful (true positives) if the unique count of records are more and duplicate records are less in the 10k volume per category.
While I've done many permutations and combinations, that is how I could lay down the above bullets, and boiled down to the following but have challenges.
"With all the experience gained, I've got 12 "Category" values (one of the Outcome) and 10 "Assgined to" values (one of the Outcome) to work upon for prediction. This means I've 2 outcomes for prediction. I've had 744 unique records at hand. I've bumped these count to get a minimum of 10 k for each unique record, to map both the outcomes, resulted in 185k+ records. The Solution Definition (for both outcomes individually) failed. My expectation is that Solution Definition should work and give lower values to the Precision, Recall and Coverage.
Net result: "I'm tiered".
Appreciate any help that can motivates me.
Thank You.
VENKAT
Covid-19 Code of Conduct: Stay Home. Stay Safe.
- Mark as Read
- Mark as New
- Bookmark
- Permalink
- Report Inappropriate Content
Hi Venkat,
What's the training error for your solutions? You can access it by app navigator > predictive intelligence > classification > solutions. Click the solution that failed, and scroll to the bottom and look for training progress. Please share a screen shot of your error.

Also when you say you have 744 unique records and you bumped it up to 185k, how did you do that? Did you duplicate the data over and over? If so if there is little variability your models will fail.
Finally are you on a Personal Developer instance (PDI) or sub prod? You may have some flexibility with your PDI on minimums.
Best, Lener
- Mark as Read
- Mark as New
- Bookmark
- Permalink
- Report Inappropriate Content
Dear Lener,
Thank you for kind reply.
Yes, I'm with you. I've understood the "Failure" it is 90% of times Step 3 failure, which means about data quality that aims to the outcome predictive field. I've done that many times.
I created Excel Macros to bump up records, covert CSV, load to import and then transform to incident table either in insert or update (coerse) mode. I'm quite successful in that because of multiple repetitive attempts of create, load, transform, delete!
I'm on PDI. You may be correct that it could be this limitation. After I wrote to you, then I started creating definitions in parts. Those are successful, For example I've 12 Categories, and in one definition I've started with 2 and kept on incrementing to 5. Some categories gave failure, then I've avoided them and tried adding others. So far I've created 2 definition sets with each 5 categories. I could be happy if I get all the 12 into 1 solution definition.
Further I could test the predictions through REST API. A success of 50:50 because this depends on the Recall % and hence the Precision %, the way I understand.
Thank you for taking time. Very kind of you.
VENKAT.
- Mark as Read
- Mark as New
- Bookmark
- Permalink
- Report Inappropriate Content
Where is part 2? I am looking for the similar tuning recommendations for similarity and clustering, but can not seem to find it, has it not published yet?
- Mark as Read
- Mark as New
- Bookmark
- Permalink
- Report Inappropriate Content
Hi Stacy, part 2 hasn't been published yet. I've been focused working on the K20 Predictive Intelligence LAB2995, which I am glad to say was published on Now Learning yesterday @ https://nowlearning.service-now.com. If you have a specific question around clustering/similarity please post into the community and either myself, PM, or any of the community members will answer until we get the next tuning article out. Best, Lener
- Mark as Read
- Mark as New
- Bookmark
- Permalink
- Report Inappropriate Content
More information on the new K20 Predictive Intelligence Lab in this post.
K20 Lab 2995 "Accelerate Incident Resolution with Predictive Intelligence & Agent Workspace"
- Mark as Read
- Mark as New
- Bookmark
- Permalink
- Report Inappropriate Content
Great reference on recall, precision
https://www.linkedin.com/pulse/aiml-product-success-metrics-carlos-lara/
- Mark as Read
- Mark as New
- Bookmark
- Permalink
- Report Inappropriate Content
A few of my lessons learned when doing many classification projects:
1. Eliminate noise from the training set. For example in your condition filter exclude event/machine generated data (i.e. created by HP or Solarwinds) or anything that is not-english.
2. If you are predicting assignment group make sure it has a normal distribution, if it's skewed ( meaning most of the records lean toward a few assignment groups) try using Gradient Boost as a advanced parameter (available in Paris).
3. Classification can now take a word corpus. Experiment with either Paragraph Vector/TFIDF as the word corpus or creating a word corpus that matches your filter conditions.
4. If on Paris try using the Predictability Estimate to find new inputs.
HTH -Lener
- Mark as Read
- Mark as New
- Bookmark
- Permalink
- Report Inappropriate Content
Hello
I am working on an assignment group classification solution and still have not gotten the results I want. Our data quality is causing quite a challenge, and I am having a rough time coming up with the right conditions to eliminate records that are skewing my results, but I am still working on that.
One thing I see is that your screenshots in this post don't match my Solution Visualization and I'm sure it has to do with the release. We are up to the Quebec release and here is a screenshot of mine. Instead of charting Precision and Coverage, in Quebec it charts Precision and Recall. So I figure my goal should be just as you say, except I would want my results to be in the upper left quadrant. Wouldn't this be correct?

You see the giant bubble in the upper left corner? That represents a bunch of assignment groups that have 100% precision and zero coverage. According to documentation, these are classes we should never include in class prediction.
- What does the 114 represent in the slider (114 out of 229)? I thought it may already be eliminating those 100/0's but it's not.
- When I change any of the class confidence records individually, this bubble chart does not update. Is that how it's supposed to be?
- When I set a specific target metric (on Precision for example), again, the bubble chart does not update but the class confidence records do update. Is that also how it's supposed to be?
- I haven't tried applying Gradient Boost yet. Can I expect that to change the bubble chart visualization so I can see the impact?
Basically I am having a hard time seeing the impact of any changes I make because I don't think this bubble chart updates, and I just want to be sure I'm not missing a step.
I haven't tried PredictabilityEstimate yet but I may try that next. In my rough analysis of my data, I don't think another input field will help my results, but it's worth trying this to find out. I'm basically trying to find ways to eliminate some of that data showing up as 100/0 with the condition builder in my solution definition, and then to even out the coverage.
Do you have any other advice that would help me?
Thanks again for all the time you have put into your articles and posts. I greatly appreciate it all!
- Mark as Read
- Mark as New
- Bookmark
- Permalink
- Report Inappropriate Content
Hi Lisa, I also enjoyed your K20 PA presentation. You're correct I wrote many of the PI tuning articles in the Paris release and am working in updating all of them to Rome. The solution visualization changed in Quebec and has recall on the X axis and precision on the Y axis.
Having your model performance with classes in the upper quadrant is still a good rule of thumb, however it's important to ask if you need high recall? If you adjust for higher recall your precision will go down. In general, you want high recall when you want the sensitivity of the model to predict true positives to be higher. For example, this may be important if you want your PI model to make sure all potential Denial of Service incidents are going to the SecOps team. Here is a great article on Recall vs Precision.
The solution visualization should update when you change your precision & recall values. I just tested on my Quebec instance, and confirmed that the bubbles do move. The only thing I can think of is you might of missed hitting the OK button when you changed the values (see fig1).
fig 1 (make sure to hit apply)

Going back to your specific questions.
- What does the 114 represent in the slider (114 out of 229)? I thought it may already be eliminating those 100/0's but it's not.
[Lener] the 114 represents the classes (pulled from ALL classes even the 100 0's) to be displayed
- When I change any of the class confidence records individually, this bubble chart does not update. Is that how it's supposed to be?
[Lener] Make sure to hit OK in fig1.
- When I set a specific target metric (on Precision for example), again, the bubble chart does not update but the class confidence records do update. Is that also how it's supposed to be?
[Lener] As I mentioned when I tested my Quebec instance my solution visualization did update. My patch level is below. If it still doesn't update for you please open a ticket and add me to the watch list (lener.pacania@servicenow.com) and I'll take a closer look with the support engineer.
Build name: Quebec
Build date: 09-07-2021_2219
Build tag: glide-quebec-12-09-2020__patch8-09-02-2021
- I haven't tried applying Gradient Boost yet. Can I expect that to change the bubble chart visualization so I can see the impact?
I've tested XGboost with a few Fortune 50 customers and have gotten really great results. The default classification algorithm is LogR. If the precision is still low I would definitely try XGBoost and compare. The solution visualization should update.
In general other classification advice:
1. Make sure the field you are predicting has a normal distribution, that is it's not all skewed to a couple assignment groups. You can see this by plotting a bar chart on the assignment group of your training set.
2. Make sure you do not have empty, nulls, weird characters in your input or output fields as that will cause the model not perform.
3. The Word Corpus is auto-generated for classification. However, I have seen improvements by creating a word corpus with filters that match you're model. You may wish to change to TF-IDF and experiment to see if that improves precision/recall.
4. Finally, in addition to support you have an entire field team that supports you. Please reach out to your sales team and they will pull a specialist architect in (I believe yours would be Chris Steinke) to be a sounding board for some of these issues.
HTH -Lener
- Mark as Read
- Mark as New
- Bookmark
- Permalink
- Report Inappropriate Content
We've been aggregating all the tuning articles on NowLearning under the PI Advanced Topics.
- Mark as Read
- Mark as New
- Bookmark
- Permalink
- Report Inappropriate Content
Hi @Lener Pacania, thank you for great article!
May I ask you please how to apply in real life the following:
- You might not be able to predict assignment group with just one model. So, plan to use multiple models. One model may not be able to predict all the assignment groups. You can call different solutions definitions in multiple passes. In Figure3, I used four classification models to predict the assignment group.
I understand this recommendation to create multiple Solution Definitions for Classification, with different inputs / filters /... , but the same output.
1. Why is it better than having just one Solution Definition where I'll put all these inputs together?
2. Can you provide details how you configured these 4 classifications models? (was the difference in filtered records, inputs, etc.)
- Mark as Read
- Mark as New
- Bookmark
- Permalink
- Report Inappropriate Content
Hi Peter,
Thanks for the input on the article. A common scenario where I've had to create multiple models to predict an assignment group is the below.
Scenario: Many assignment groups that do the same thing
Say you are trying to predict assignment group from short_desc = "password reset". You build one model and it always predicts India Service desk. When you look at your data you realize that you have several Service Desks in India, Asia, US, and Europe that all have incidents with short_desc = "password reset", with India having the highest volume of "password reset" incidents. When you train this model you encounter what I like to call "winner take all" scenario where India will always get predicted because it has the highest volume of password resets.
Now in this case you can do one of many things. (1) you can try to stick with one model and continue to add unique inputs (say a location_id) to try to predict the right assignment group. (2) or you can create a model for each geography (i.e. India, US, and Europe) each predicting assignment group from short_desc for their specific geo.
So now you say ok, I have multiple models based on geo and performance seems to be better. How do I implement this? You can do so in a couple ways:
1 - Use FlowDesigner and a PI action to have case logic which would say IF location_id = India, run India Predict Assignment Group Model then IF location_id = US, run US Predict Assignment Group Model.
2 - Use a Business Rule and the ML API () to call each model using conditional logic in your Java Script and Glide Script
Circling back to your specific questions:
1. Why is it better than having just one Solution Definition where I'll put all these inputs together?
[Lener] I always prefer one solution definition if you can get there with the right combination of inputs. To get extra help finding highlight correlated inputs to your outputs see this article.
2. Can you provide details how you configured these 4 classifications models? (was the difference in filtered records, inputs, etc.)
[Lener] as I mentioned above, if you decide that multiple classification models are better then the big difference will be the filtered records that you use to train the model, in my example I've used location_id, product_id's anything to narrow down the training data to build the model.
HTH -Lener
- Mark as Read
- Mark as New
- Bookmark
- Permalink
- Report Inappropriate Content
A few customers have asked me for the older pre-Paris business rules to implement predictive intelligence, so I am including here for reference. Figure 1 has the Business Rule definition. Figure 2, is the code snipped that shows you what you should paste into the advanced tab. I am also attaching the script.
Note - as of San Diego, the business rule to call your predictive intelligence solutions is "Default Task Based Prediction". It calls all active PI solutions and looks for events against the task table.

(figure 1 - Business rule definition)
/*************************************************************************
*** Call Solution Definition  ***
*** Older BR to call Predictive Intelligence **
*************************************************************************/

(function executeRule(current, previous /*null when async*/) {

	var solutionNames = ["ml_incident_categorization", "ml_x_snc_global_global_incident_assignment_br", "ml_incident_categorization", "ml_x_snc_global_global_incident_priority"];

	var predictor = new MLPredictor();
	var info = "";
	solutionNames.forEach(function(solutionName) {
		var solution = predictor.findActiveSolution(solutionName);
		if (!solution)
			return;

		/* The next line of code is doing the prediction and updating current record. */
		/* If no prediction is done, we don't build prediction info message. */
		if (!predictor.applyPredictionForSolution(current, solution))
			return;

		/* If user doesn't have 'itil' role, we don't build prediction info message. */
		if (!gs.hasRole('itil'))
			return;

		/* Building prediction info message */
		var fieldName = solution.getPredictedField();
		var fieldLabel = current.getElement(fieldName).getED().getLabel();
		var predictedDisplayValue = current.getDisplayValue(fieldName);
		var msg = gs.getMessage("Predicted {0} for {1}.", [predictedDisplayValue, fieldLabel]);
		if (info.length > 0)
			info += " ";
		info += msg;
	});
	/* Print out prediction info message on screen. */
	if (info.length > 0) {
		var incidentUrl = "<a href='"+current.getLink()+"'>"+current.number+":</a>";
		gs.addInfoMessage(incidentUrl + " " + info);
	}
})(current, previous);
(figure 2 - older business rule code)
- Mark as Read
- Mark as New
- Bookmark
- Permalink
- Report Inappropriate Content
San Diego Update - Many of you may display the prediction in a blue box using the above code in your UI Action on your form or in a business rule for Agent Workspace. As of San Diego we now automatically show the predictions for several of the out of the box classification models in the Service Operations Workspace and for the HR Agent Workspace (see below).
Service Operations Workspace

HR Agent Workspace

- Mark as Read
- Mark as New
- Bookmark
- Permalink
- Report Inappropriate Content
I can understand the multiple-solution option, even if it's just to be able to train 'more' data to a specific region to give a broader result lexicon.
My query is about classification 'stacking'. In short, we don't want to predict the group, we want to predict the SERVICE first and then the CATEGORY for that Service.
In both of these circumstances you're going to need HR AI Configurations but it's only possible to have a single Classification active per domain (and other than the Global domain, the only others appear to be user groups).
So the questions are:
a) How do you run PI against different solutions with the same 'Service' Classification (e.g. India, USA, UK). The predictor can only look at one?
b) Is it possible to run secondary solutions based on the first solution (e.g. 'Service' = 'Payroll' then filter down to predict 'Category' = payslips? Again, this is predicated on having multiple classifications on the same domain.
Thanks
- Mark as Read
- Mark as New
- Bookmark
- Permalink
- Report Inappropriate Content
Looks good but before I can try this, I will first need to find a way of adding 10K+ incident records to my dev instance...
- Mark as Read
- Mark as New
- Bookmark
- Permalink
- Report Inappropriate Content
You'll need 10000+ no matter what when you're in the production path, which is usually difficult.
As for adding 10000 rows, just create an excel and replicate rows until you have 10000+. Then replace the descriptions with a repeated list of say 50 different phrases. The load to case/incident via import set.
I didn't get a response to my 'stacked queries' question. Suffice to say, ML isn't brilliant and is significantly better in predicting Group than Service etc.
- Mark as Read
- Mark as New
- Bookmark
- Permalink
- Report Inappropriate Content
Pls share the script for getting models displayed in blue boxes as shown in the screen shot.

- Mark as Read
- Mark as New
- Bookmark
- Permalink
- Report Inappropriate Content
Script Include is hr_CaseAjax that displays the message, which I highlighted in the screenshot below.
Regards,
Brian

- Mark as Read
- Mark as New
- Bookmark
- Permalink
- Report Inappropriate Content
Hi @Lener Pacania1 ,
I am working on a solution to predict Assignment group using Classification. We have a scenario where incidents get created in multiple languages. Could you provide guidance on how to train the model when input data is in different languages? How to classify and differentiate incidents that are having non English text in the input dataset? Thanks in advance!