- Post History
- Subscribe to RSS Feed
- Mark as New
- Mark as Read
- Bookmark
- Subscribe
- Printer Friendly Page
- Report Inappropriate Content
09-11-2021 07:53 AM - edited 04-17-2023 08:07 AM
Hi Folks,
This article covers how Pattern Pre Post Scripts [Pre Execution, Pre and Post Sensor] can be debugged using OOB Script Debugger Utility.
Target Audience
Anyone using Discovery product using Patterns on their SNOW instance.
Overview
You must be aware that ITOM Discovery product uses Probes/Patterns for discovering all kinds of resources. Starting Newyork (NY) SNOW recommends to migrate to patterns over probes as patterns being the future.
In this context, I would like to share how we can debug the pre post scripts using the inbuilt script debugger utility i.e. available OOB itself located as in below image.

Pre-Requisites
1. Need to customize the condition in "Run Again (Debug)" UI Action from "maint" to "discovery_admin".
2. You need to log in to your snow instance with "discovery_admin" role in order to debug the pre post scripts using script debugger utility as shown above.
3. You need to have a proper discovery log [either by running discovery or importing log from some other instance] so that we have execution entities and then we can keep breakpoints and attach the context and debug per below mentioned procedure.
Debugging
Once you met the per-requsites:
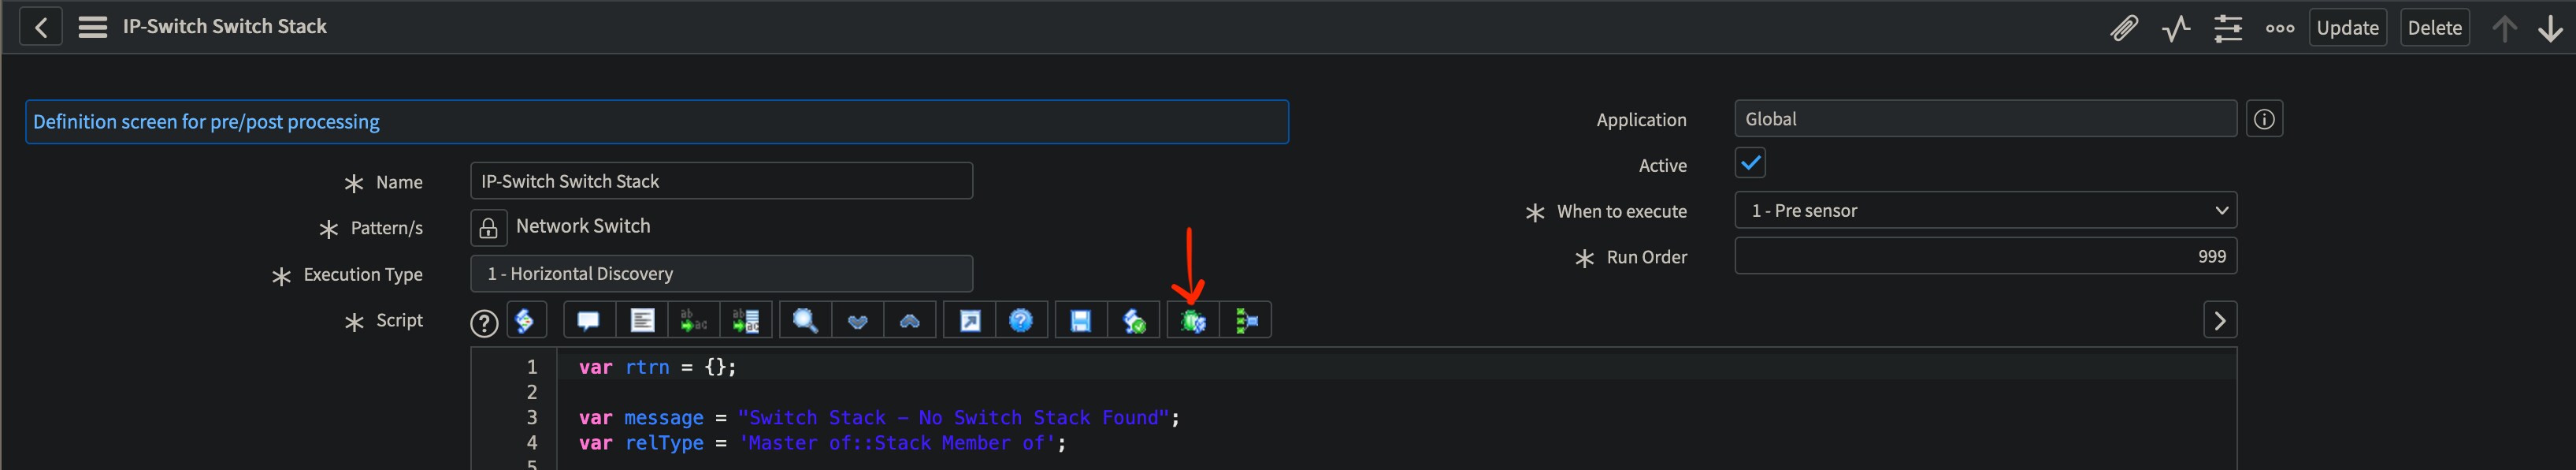
- Keep breakpoints in the respective pre post scripts which were triggered as part of the discovery log.
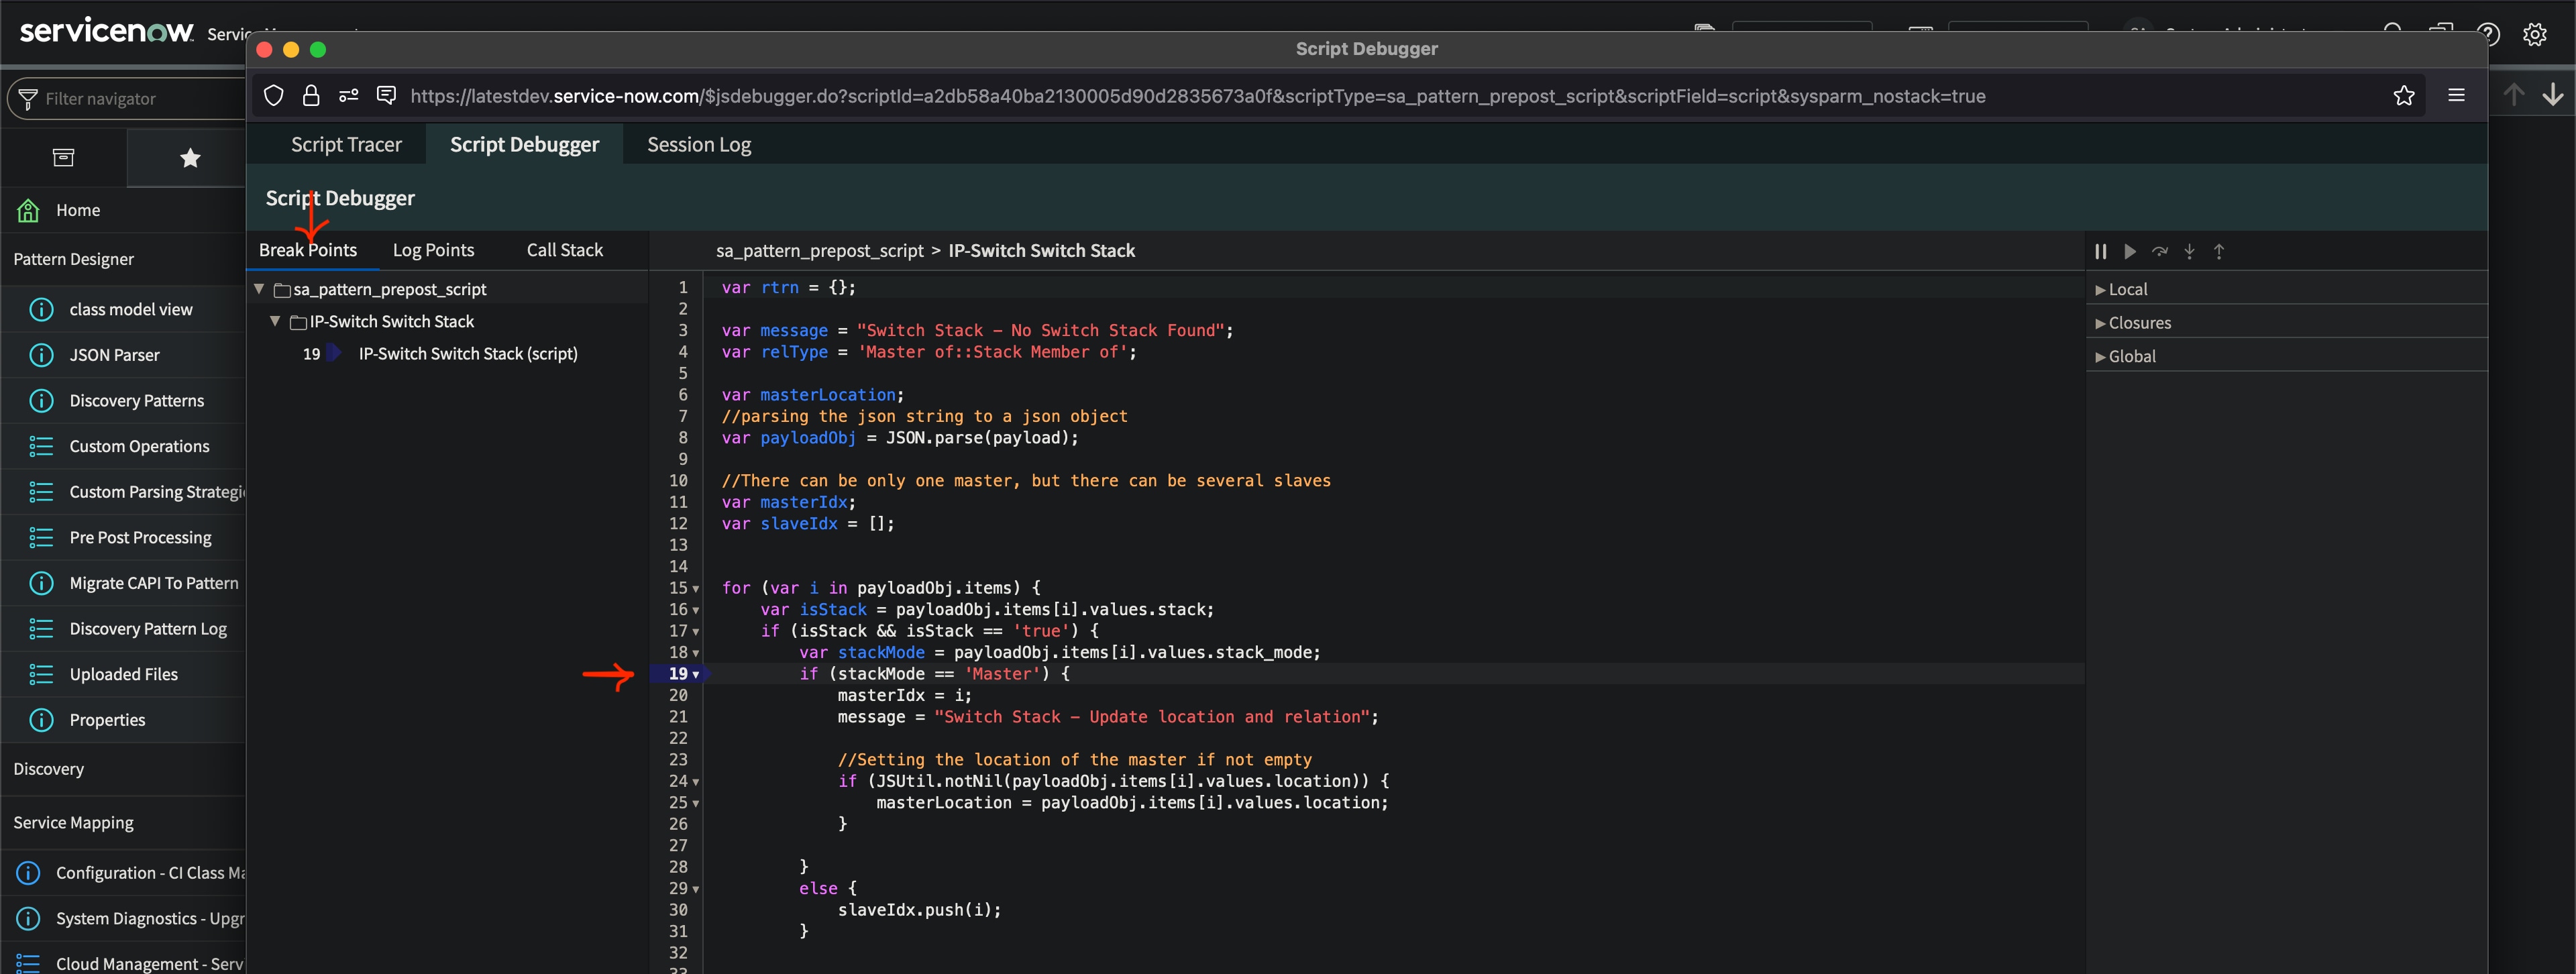
- Launch the Script Debugger by clicking the icon from the toolbar as highlighted above in image, once the debugger is opened, you can see all the scripts where breakpoints were kept as in below image.

- You can even see the entire call stack till the script where you kept the breakpoints in the "Call Stack" tab above once debug is started.
- So with this window coming up, we are ready to attach the context of the discovery log which we just made it available.
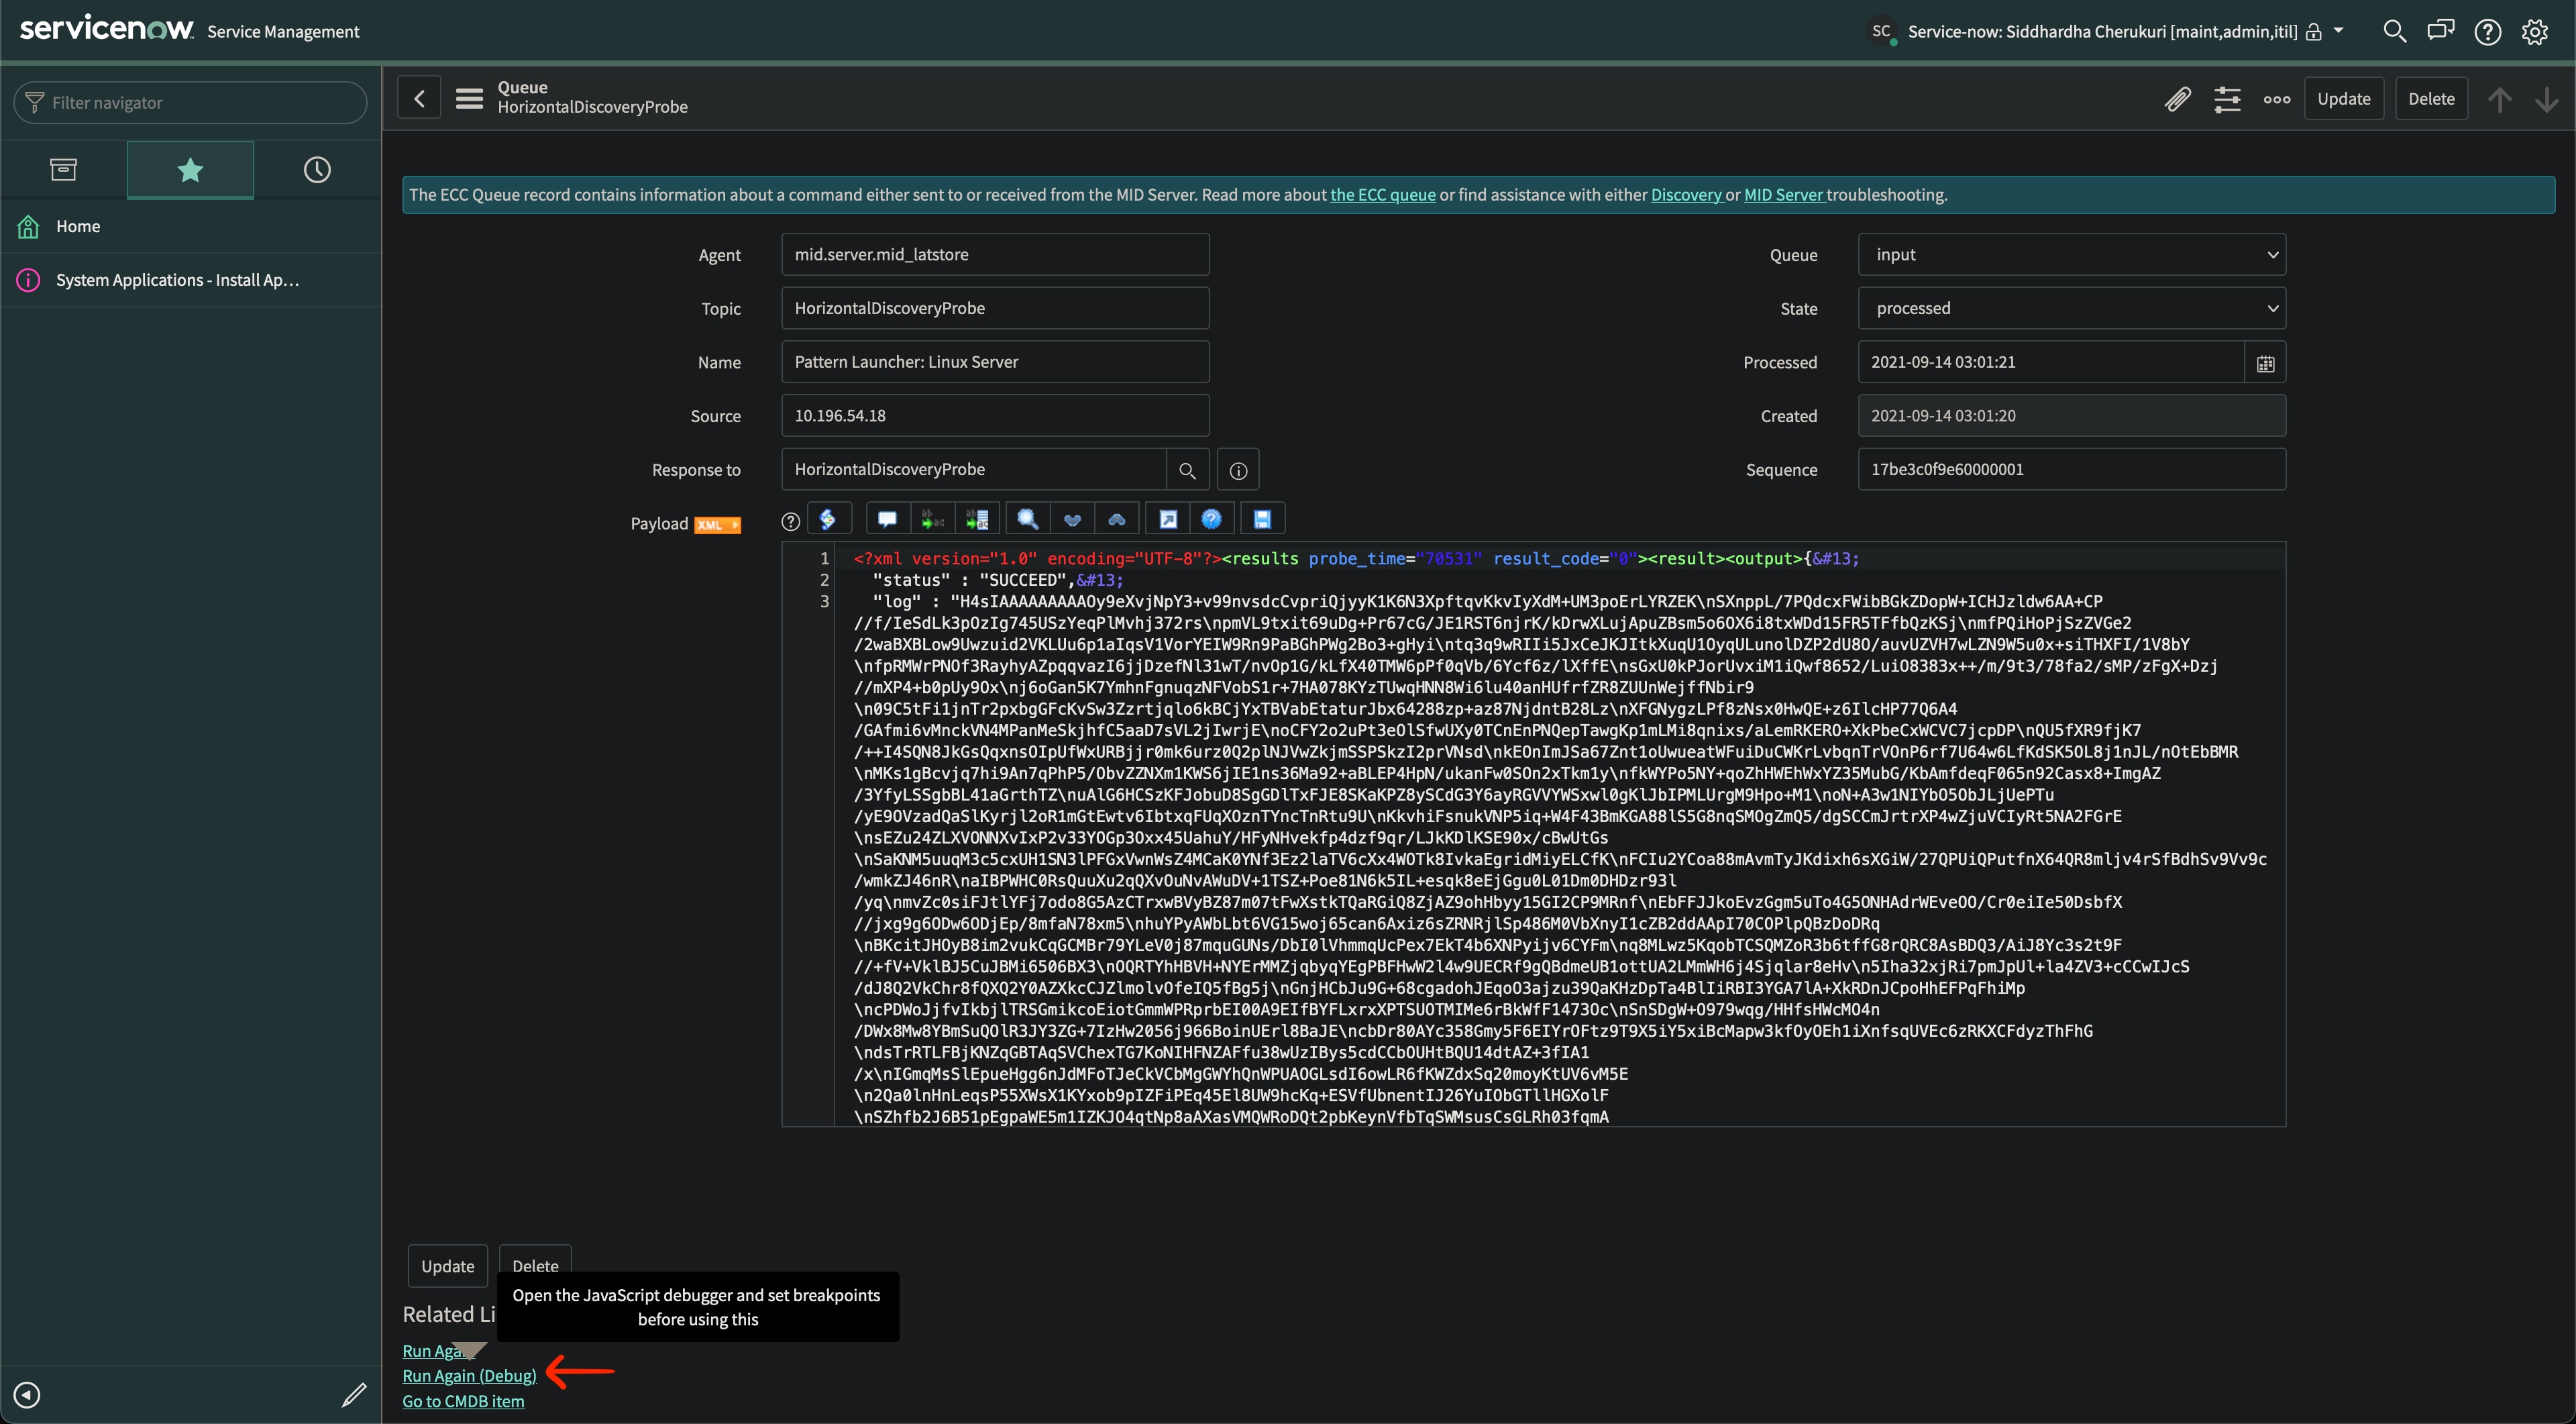
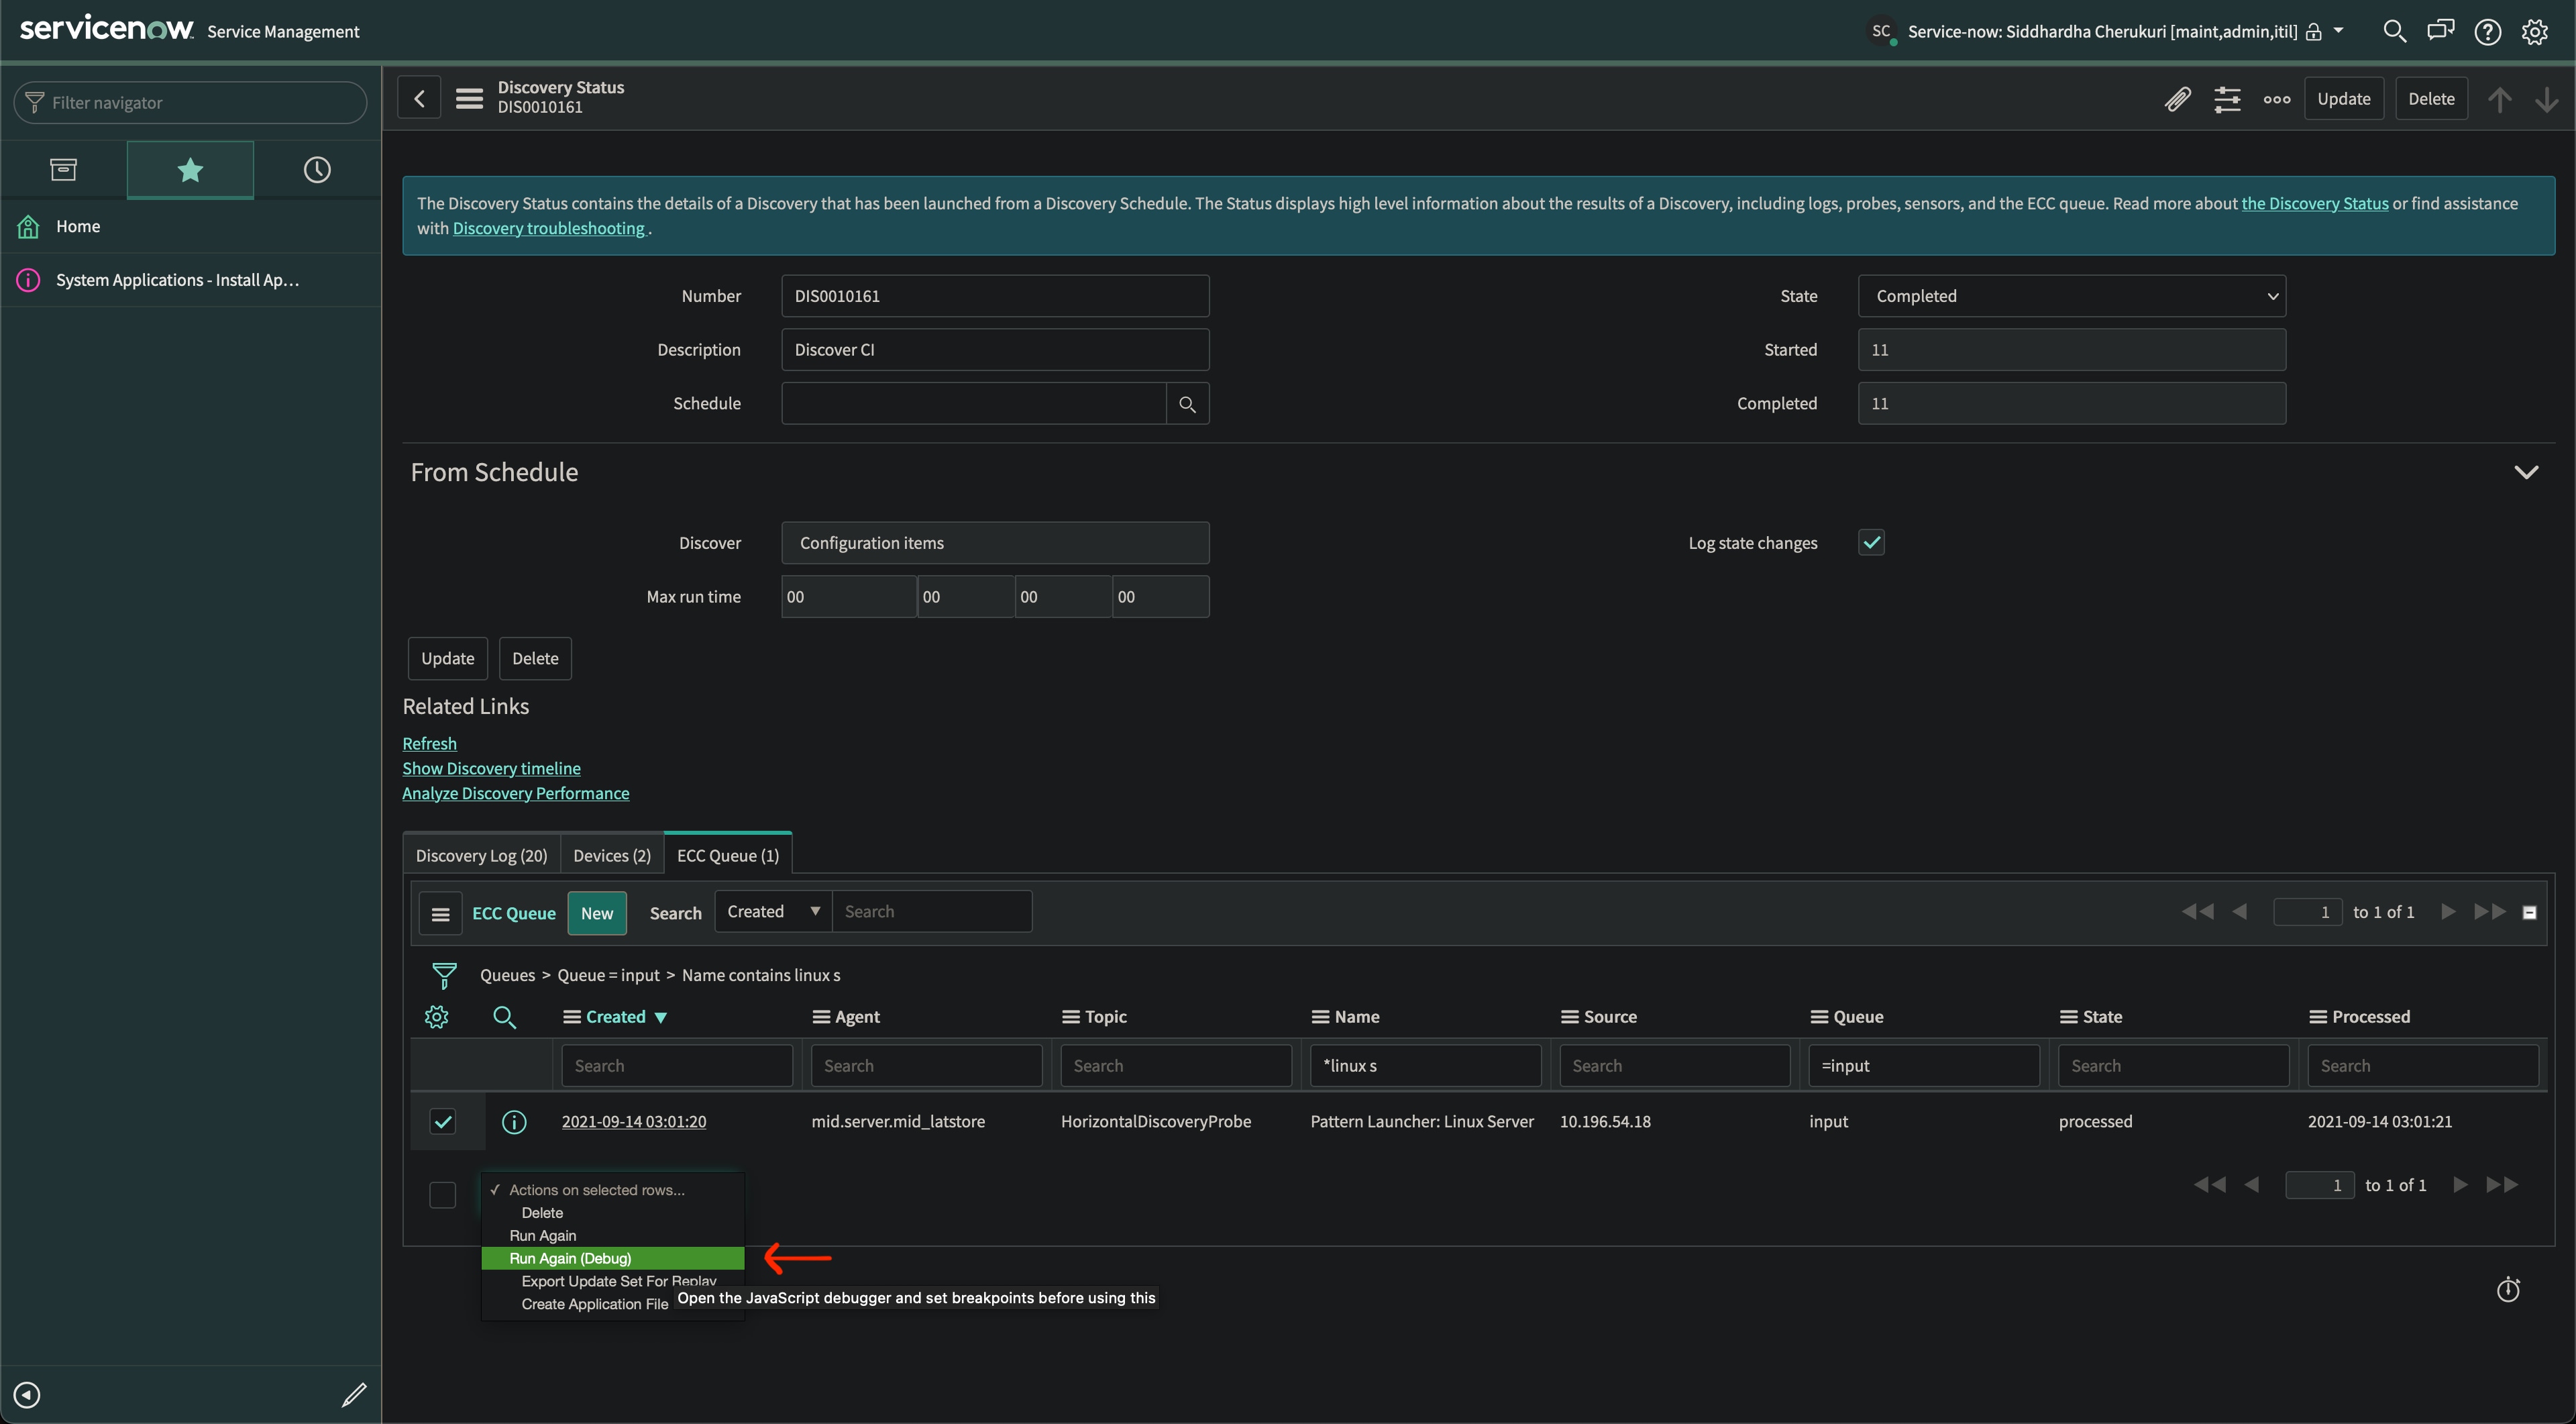
- Now open the discovery log and navigate to "ECC Queue" related list and select the "input" record of the respective pattern execution for which you wanted to debug.
- Now we need to re run this input payload with debug mode to be able to attach this execution context to the script debugger using "Run Again (Debug)" option as in below images. This option is available as action on selected items dropdown and UI Action on ECC Queue Input Record.


- Once the above option is clicked open the script debugger window and you will see the context gets attached and halted at the first break point per logical execution flow.
- Now you can navigate the code step by step and observe the values being changed in the right pane and as well the call stack gets populated.
- You can navigate the code using the options available in the top right pane.
- Once you stop the debugging, the payload for which we ran will get reprocessed and respectively cmdb gets created/updated like wise the regular discovery flow.
Note: You can't use this script debugger for debugging scripts from mid server context like mid server script includes, custom operations.
Hope this article helps you out debugging for critical scenarios with pattern's pre post scripts.
- 10,304 Views
- Mark as Read
- Mark as New
- Bookmark
- Permalink
- Report Inappropriate Content
Please refer this foundation article for basic understanding and applicability of Pattern's Pre Post Scripts.
- Mark as Read
- Mark as New
- Bookmark
- Permalink
- Report Inappropriate Content
Followed both pages and I value the blog you have penned with your experience. Thanks, Much @Sid.
- Mark as Read
- Mark as New
- Bookmark
- Permalink
- Report Inappropriate Content
What other variables are available to pre processing script? is there a way of getting the MID server name that was used to get the payload?
- Mark as Read
- Mark as New
- Bookmark
- Permalink
- Report Inappropriate Content
I don't remember so, it has a lot of context data and in debug mode, you can check what all you have.
Specific to this mid server name query, may I know why do you need that, like wanted to know what's your requirement.
Usually, the mid server name is available in the metadata of ECC records and pattern logs too.
- Mark as Read
- Mark as New
- Bookmark
- Permalink
- Report Inappropriate Content
The need is to set an attribute of a discovered CI based on the MID server it was discovered from. All discovered CIs have ServiceNow as Discovery source attribute value, which is not very useful when you have multiple affiliates and need to know from which network it was discovered (each affiliate can have multiple MID servers), so knowing from which MID server the payload was received would allow to set certain custom attribute values indicating the network of discovery (not only for debugging purposes). I managed to get the MID server name by extracting some data from pre/post processing payload and searching in ecc queue, but is that the only way? is there a better way of doing that?
- Mark as Read
- Mark as New
- Bookmark
- Permalink
- Report Inappropriate Content
Hi @Haykaz
Firstly, suppose you have CIs that are not discovered using ServiceNow Discovery, in that case, the Discovery Source attribute will have a different value, and you can figure/filter out CIs to know how they came to CMDB.
Reg your query, a post insert BR would do the job simply as the CI gets inserted already, and you will know the value of the mid server that inserted that record, and you can have your custom attribute filled in based on the mid.
Also, you can do the same in the pattern post sensor scripts as well.
I hope this helps...
- Mark as Read
- Mark as New
- Bookmark
- Permalink
- Report Inappropriate Content
Hi Guys,
I raised it through HI portal already but maybe you know already: I wanted to repeat what I did successfully for "Windows Servers - OS", "Linux Server" and two database patterns for "Amazon AWS - Network (LP)" and "Amazon AWS - Virtual Server (LP)": cleaning up some cmdb_key_value records based on payload items processed by the Sensor but in the post-sensor script the 'payload' variable is NULL... Do you know if the variable name is different, the concept is different for Cloud patterns or just something is broken in the instance I was working on? Thanks in advance!
- Mark as Read
- Mark as New
- Bookmark
- Permalink
- Report Inappropriate Content
Hi @Community Alums,
Recently we changed globally on most pre-post scripts to reset the variable to NULL once the payload is consumed to free up memory in case of large payloads.
But you should be able to see that payload in some other variable as a JSON object and continue debugging. You can make out the variable names by looking at the scripts.
- Mark as Read
- Mark as New
- Bookmark
- Permalink
- Report Inappropriate Content
Hi @SiD2 ,
When I read your response I first thought you referred to the 'payload = null' line which I saw in scripts (and copied to mine, here line 13):

But then I was enlightened and checked-out the 'Populate memory and vcpus for Virtual Server' post-sensor script for 'Amazon AWS - Virtual Server (LP)' pattern. And now I know what you meant:

So here it is a Glide Record and not just text and I just need to use the same processing the ootb one uses.
Thank you for your help (and great article btw!)