- Post History
- Subscribe to RSS Feed
- Mark as New
- Mark as Read
- Bookmark
- Subscribe
- Printer Friendly Page
- Report Inappropriate Content
09-11-2021 07:53 AM - edited 04-17-2023 08:07 AM
Hi Folks,
This article covers how Pattern Pre Post Scripts [Pre Execution, Pre and Post Sensor] can be debugged using OOB Script Debugger Utility.
Target Audience
Anyone using Discovery product using Patterns on their SNOW instance.
Overview
You must be aware that ITOM Discovery product uses Probes/Patterns for discovering all kinds of resources. Starting Newyork (NY) SNOW recommends to migrate to patterns over probes as patterns being the future.
In this context, I would like to share how we can debug the pre post scripts using the inbuilt script debugger utility i.e. available OOB itself located as in below image.

Pre-Requisites
1. Need to customize the condition in "Run Again (Debug)" UI Action from "maint" to "discovery_admin".
2. You need to log in to your snow instance with "discovery_admin" role in order to debug the pre post scripts using script debugger utility as shown above.
3. You need to have a proper discovery log [either by running discovery or importing log from some other instance] so that we have execution entities and then we can keep breakpoints and attach the context and debug per below mentioned procedure.
Debugging
Once you met the per-requsites:
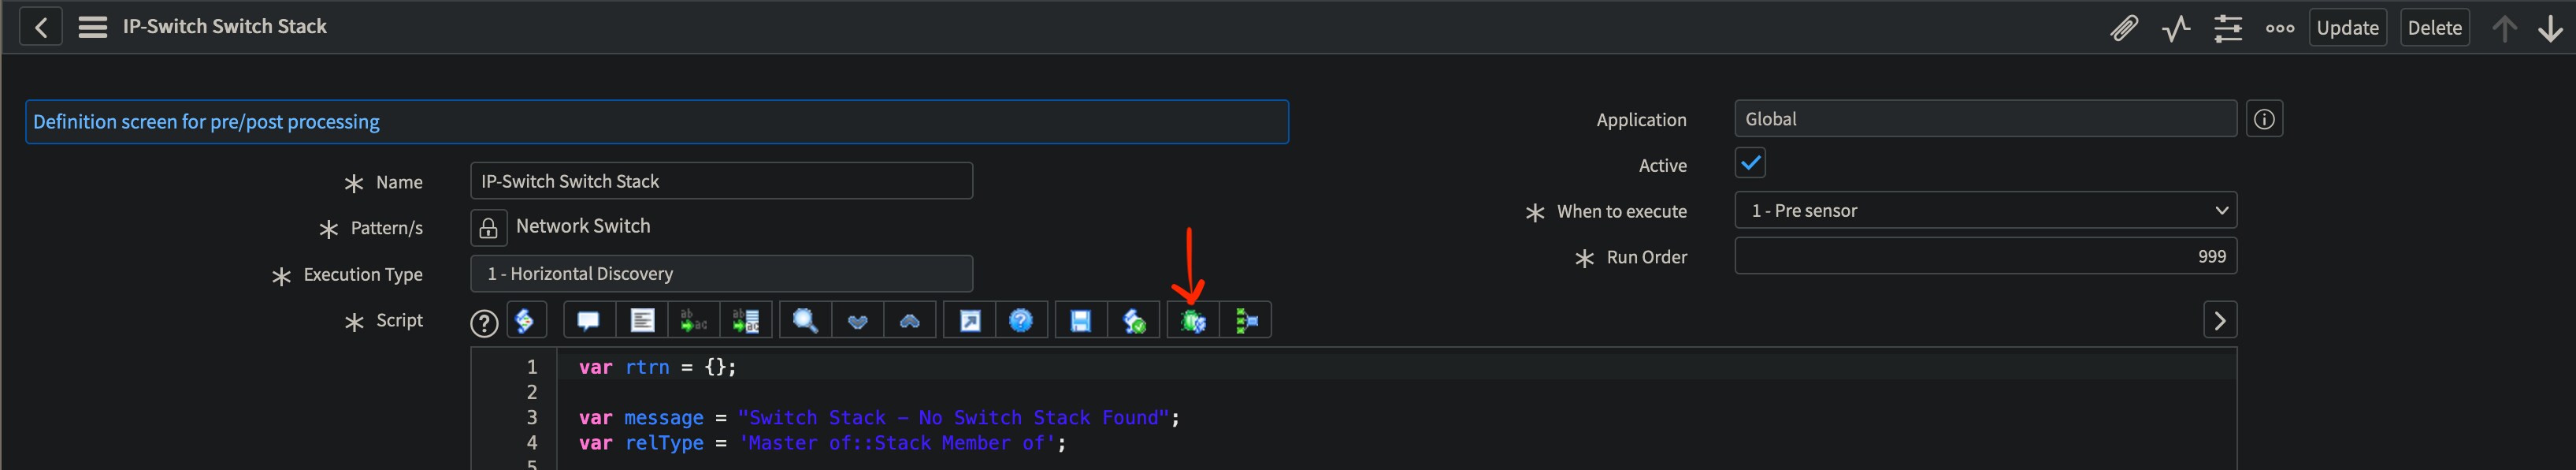
- Keep breakpoints in the respective pre post scripts which were triggered as part of the discovery log.
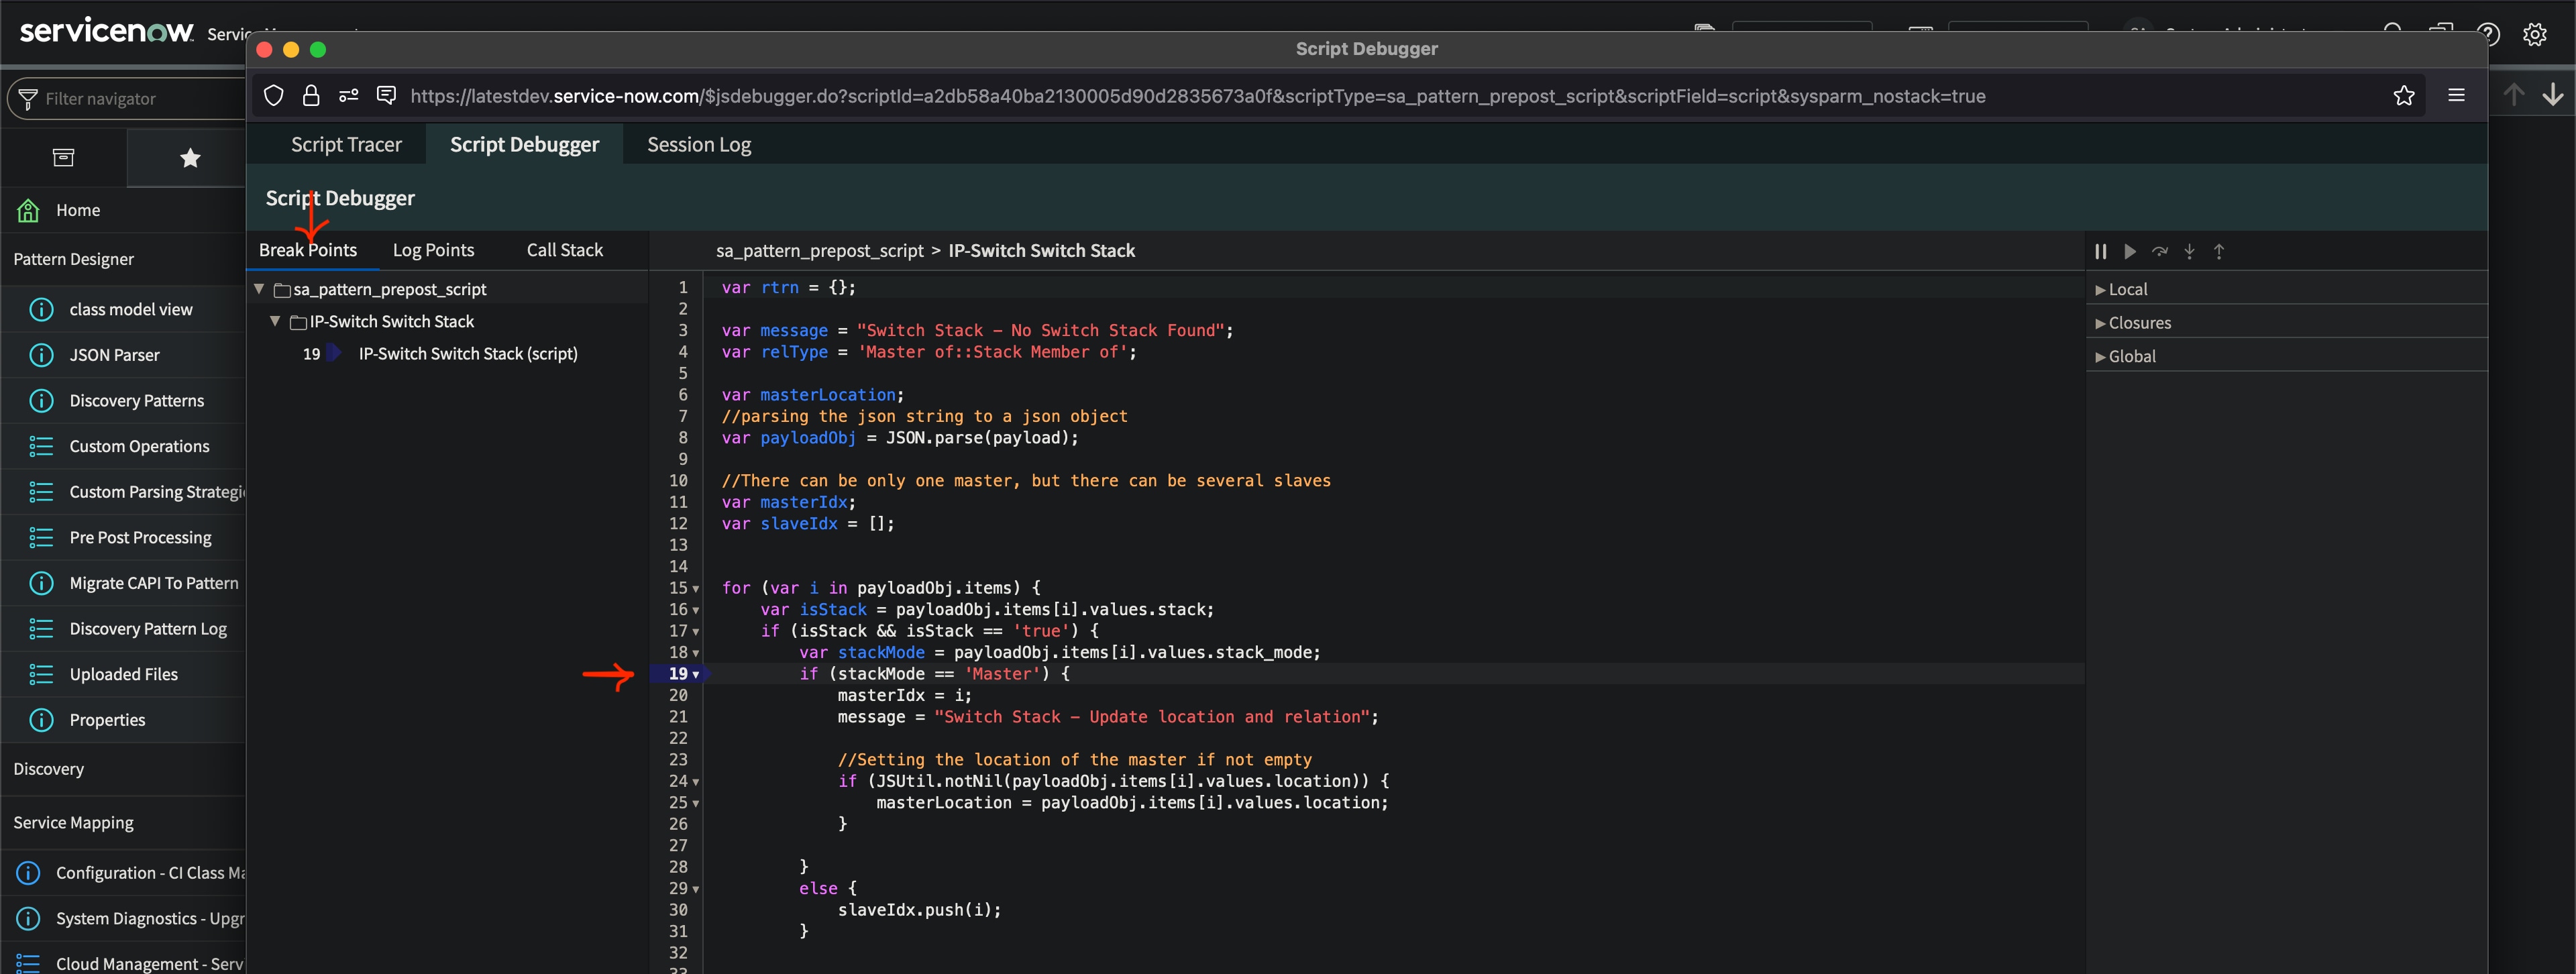
- Launch the Script Debugger by clicking the icon from the toolbar as highlighted above in image, once the debugger is opened, you can see all the scripts where breakpoints were kept as in below image.

- You can even see the entire call stack till the script where you kept the breakpoints in the "Call Stack" tab above once debug is started.
- So with this window coming up, we are ready to attach the context of the discovery log which we just made it available.
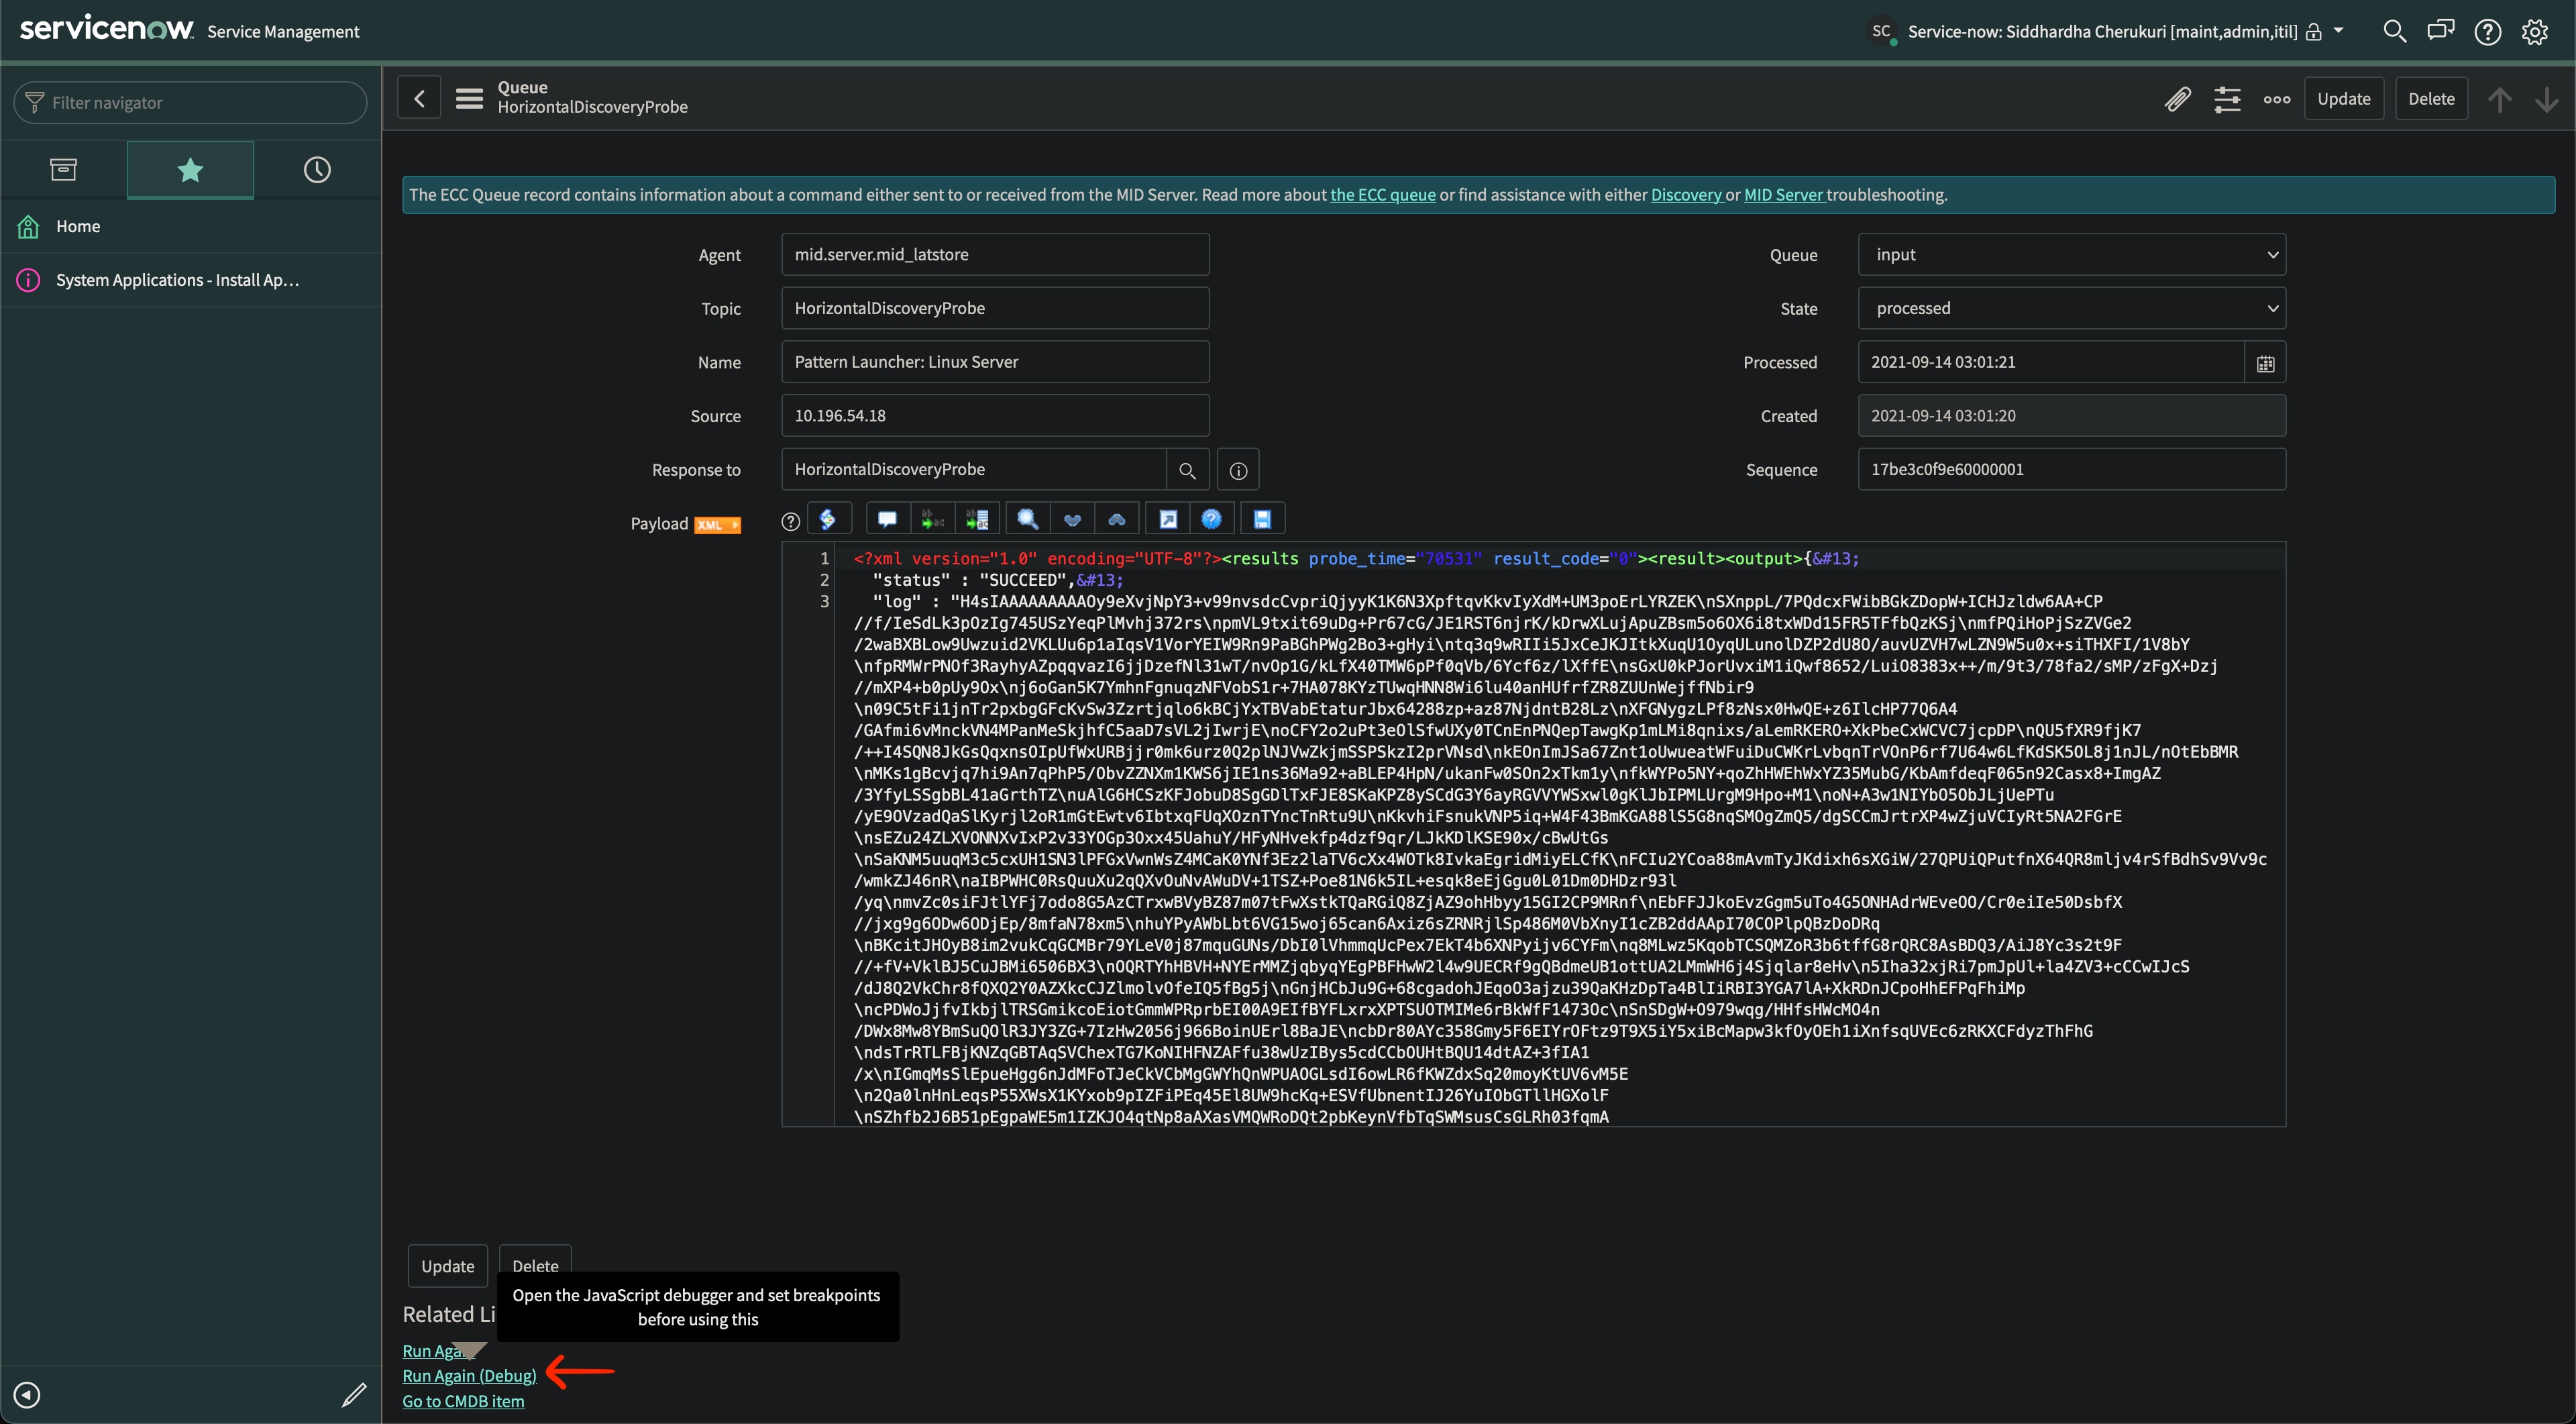
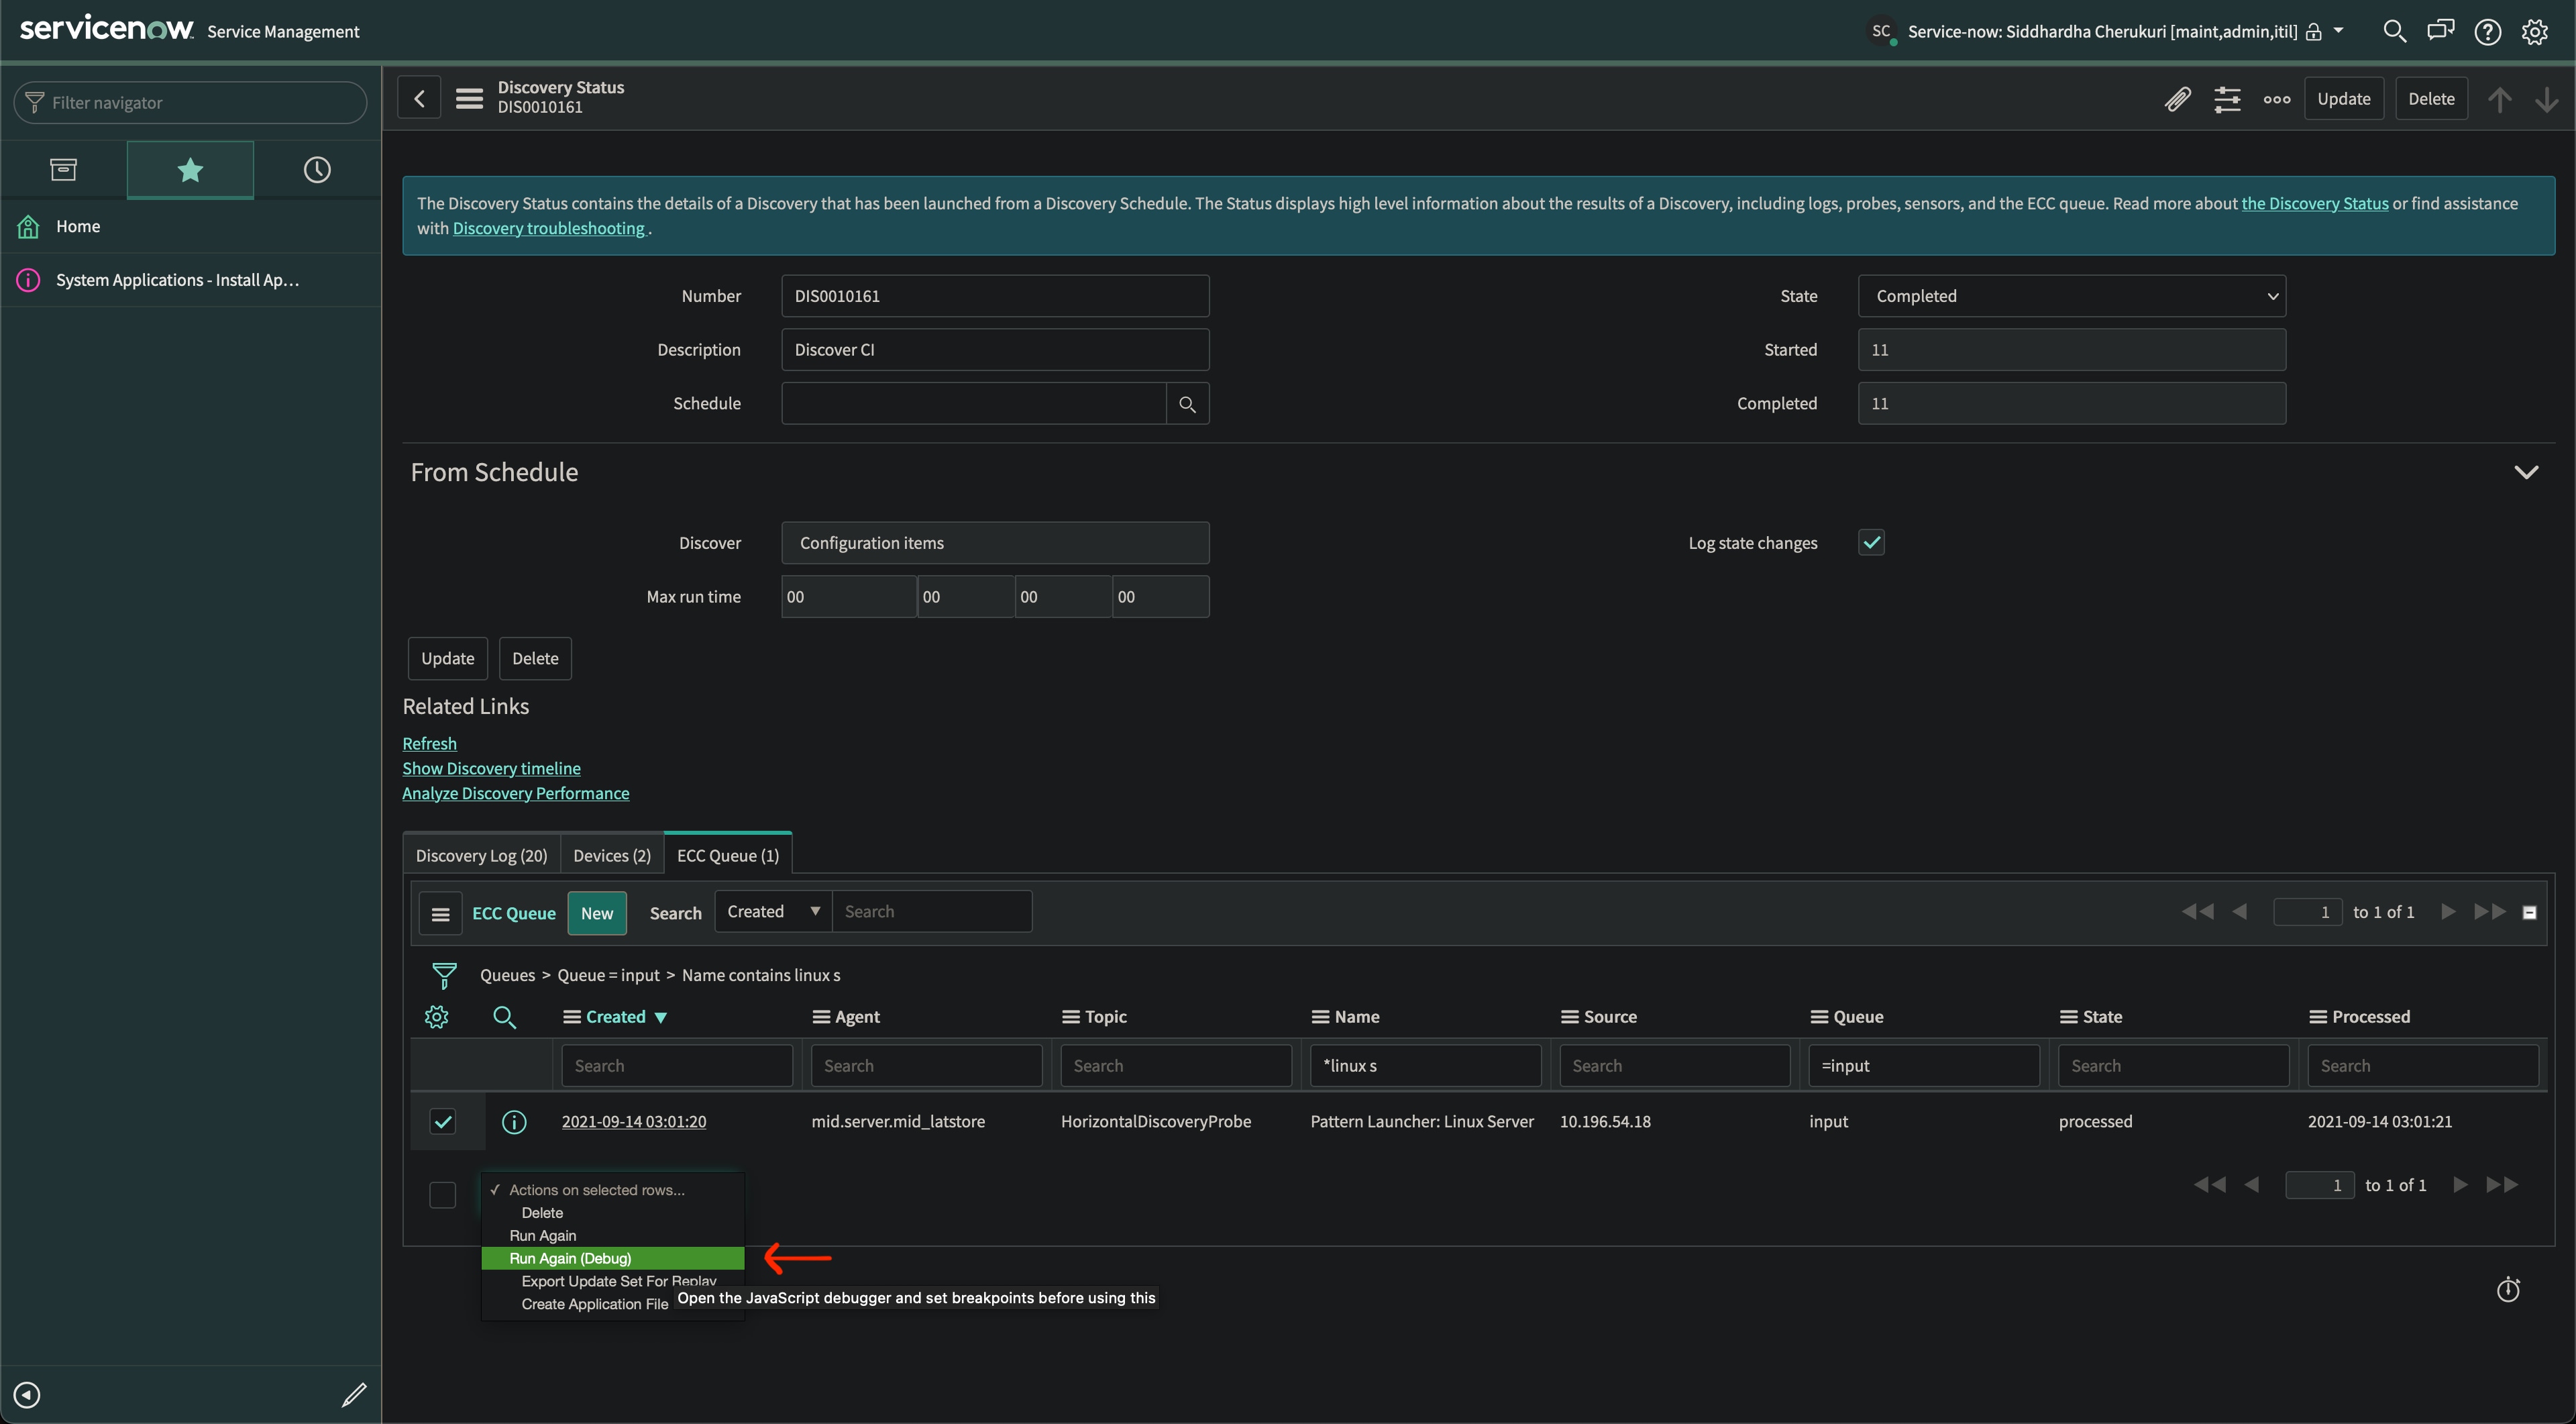
- Now open the discovery log and navigate to "ECC Queue" related list and select the "input" record of the respective pattern execution for which you wanted to debug.
- Now we need to re run this input payload with debug mode to be able to attach this execution context to the script debugger using "Run Again (Debug)" option as in below images. This option is available as action on selected items dropdown and UI Action on ECC Queue Input Record.


- Once the above option is clicked open the script debugger window and you will see the context gets attached and halted at the first break point per logical execution flow.
- Now you can navigate the code step by step and observe the values being changed in the right pane and as well the call stack gets populated.
- You can navigate the code using the options available in the top right pane.
- Once you stop the debugging, the payload for which we ran will get reprocessed and respectively cmdb gets created/updated like wise the regular discovery flow.
Note: You can't use this script debugger for debugging scripts from mid server context like mid server script includes, custom operations.
Hope this article helps you out debugging for critical scenarios with pattern's pre post scripts.
