


vNick

ServiceNow Employee
Options
- Subscribe to RSS Feed
- Mark as New
- Mark as Read
- Bookmark
- Subscribe
- Printer Friendly Page
- Report Inappropriate Content
02-13-2018
11:53 AM
Starting in Kingston, the Operational Intelligence module provides an out of the box connector for pulling Amazon Web Services (AWS) CloudWatch metrics. While there are many benefits to operational intelligence, from capacity planning to proactive avoidance of outages, this article will not be an overview of what Operational Intelligence (OI) can do, but rather a specific methodology for extending default metrics sent from AWS to OI. The following articles can provide great overviews of what OI is capable of doing.
OI — ML Summary by Simon White
Operational Intelligence in world of ML & AI by Puru Amradkar
Outage Prevention with Operational Intelligence by Aleck Lin
Operational Intelligence Algorithms by Alexander Margarit
Knowledge17 Session: Operational Intelligence — Event Management vNext
Like most software, there is occasion where a customer may want to extend the functionality provided "out of the box". In the case of sending metric data to ServiceNow from AWS CloudWatch, adding metrics that are not provided by AWS in their standard collection process would be a typical example. Two of these that I saw right away are memory utilization and disk space utilization. CPU utilization is provided, but these other two key metrics would be critical for any capacity management effort as well as resource monitoring requirement. This blog aims to show you how you can add these metrics to the CloudWatch stream and then pull them into the Operational Intelligence module of ServiceNow.
Another important topic to call out prior to getting into the details is that of 3rd party monitoring systems. Most organizations already use a monitoring tool (or 10), and these tools (Nagios, SCOM, SolarWinds, Zabbix, PRTG, collectd, etc) have the ability to capture nearly any metric possible. These are all great sources to also send into Operational Intelligence, but they require extending into the AWS environment and CloudWatch is already there running all the time, so for those not wanting to extend those tools into AWS, this article is for you (though AWS does let you install their agent in on-premises resources to and send data to CloudWatch too).
Step 1: AWS Setup
The great part about CloudWatch is that it's native to the AWS platform and so there is essentially no setup. That said, if you leverage AMI's to deploy instances, the following steps may necessitate an update to those AMI's to have your custom metrics included in any new provisioning requests. AWS provides the documentation for adding custom metrics, but I'll break down the high-level steps here.
You can find details for custom metrics for Linux here (note they're just facilitating for memory and disk space), but these are the basic steps:
- Login to Linux instance
- Install various perl packages (and others depending on O/S type)
- Download and install the monitoring scripts (perl scripts as you can imagine) — thank you AWS for creating these!
- Create a crontab entry to collect metrics at specific frequency (crontab —e)
- In my testing I used the following, which gets consolidated disk space utilization versus mount by mount and collects the stats every 5 minutes
*/5 * * * * ~/aws-scripts-mon/mon-put-instance-data.pl --mem-util --mem-used-incl-cache-buff --mem-used --mem-avail --disk-space-util --disk-space-used --disk-space-avail --disk-path=/ --from-cronExample crontab for Linux
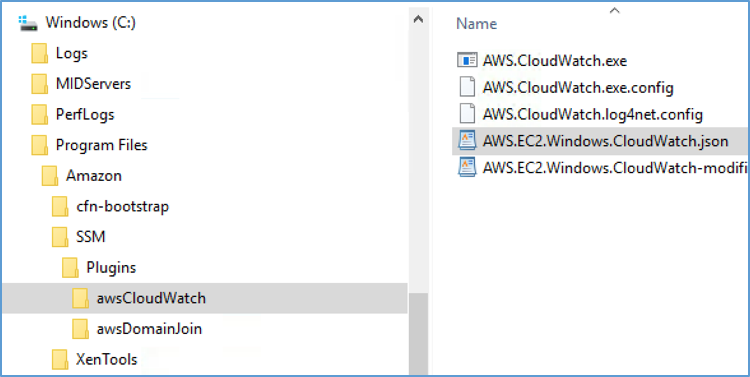
You can find details for customer metrics for Windows here, but these are the basic steps:
- Of the 3 options AWS provides, I chose to use the Local Configuration File option
- Login to Windows instance
- Ensure the latest version of the SSM Agent is installed on the Windows instance
- Edit AWS.EC2.Windows.CloudWatch.json file
- Change "IsEnabled" to "true"
- Add custom metrics just prior to section contain Access Key (and yes, the secret key is in this file too, clear text).
- Restart the SSM Agent service
JSON File to Modify
{
              "FullName": "AWS.EC2.Windows.CloudWatch.PerformanceCounterComponent.PerformanceCounterInputComponent,AWS.EC2.Windows.CloudWatch",
              "Id": "PerformanceCounterMemory01",
              "Parameters": {
                  "CategoryName": "Memory",
                  "CounterName": "% Committed Bytes In Use",
                  "DimensionName": "InstanceId",
                  "DimensionValue": "{instance_id}",
                  "InstanceName": "",
                  "MetricName": "MemoryUtilization",
                  "Unit": "Percent"
              }
          },
          {
              "FullName": "AWS.EC2.Windows.CloudWatch.PerformanceCounterComponent.PerformanceCounterInputComponent,AWS.EC2.Windows.CloudWatch",
              "Id": "PerformanceCounterDisk01",
              "Parameters": {
                  "CategoryName": "LogicalDisk",
                  "CounterName": "% Free Space",
                  "DimensionName": "InstanceId",
                  "DimensionValue": "{instance_id}",
                  "InstanceName": "_Total",
                  "MetricName": "DiskSpaceUtilization",
                  "Unit": "Percent"
           }
},
Custom Metric section of AWS.EC2.Windows.CloudWatch.json file
An important consideration to keep in mind is common naming of metrics across both Linux and Windows. If you want to report these metrics in a common roll-up fashion, be sure to give them the same name so that the CI in ServiceNow that represents the instance has a common metric regardless of O/S type.
Step 2: ServiceNow MID Server and Connector Setup
While all the detailed instructions for setting up the MID server with requisite extensions and connector instances can all be found in the OI Getting Started docs, there are a couple of items worth mentioning outside of that documentation.
First, the MID Server cluster used for OI is of the new type "Distributed", but that does not mean that the MID Servers in the cluster can only be used for OI. In fact, the docs say to use the same MID Server for regular events as for metric collection if you're using the default SCOM connector. Consider the added load on the MID server(s) for processing these extra metrics when determining whether or not to create new MIDs.
Second, when defining the AWS connector instances, be sure to explicitly define all the parameters noted in the docs, even when they note an "Optional value" which does not mean a default value. And finally, when defining the connector instance, be sure to choose one of the MID servers you have in the distributed cluster and not the cluster itself. As of this writing, the cluster could not be specified (but this will likely change in the future).
Step 3: ServiceNow Event Rules Setup
Operational intelligence delivers 2 baseline event rules for handling AWS CloudWatch Metrics (as of Kingston). Depending on how many custom metrics and the namespace they end up in, you will need to create your own event rules because the baseline rules filter on the namespace value, and your custom metrics likely will not show up in this namespace.
Baseline AWS VM Event Rule
In my case, I had to create 2 new rules. One rule for Linux and the other for Windows. I started on the "AWS Metrics Virtual Machine" rule in the screenshot above and just did an "Insert and Stay", then changed the name to insert "linux" and "windows" into the name value of the rule. I then changed the namespace value to what is reflected in the AWS Console when browsing CloudWatch metrics. These namespace values are controllable within the Linux perl scripts deployed or the JSON config file on the Windows instances.
Custom Linux Event Rule
Custom Windows Event Rule
Step 4: (if necessary) ServiceNow MetricBase Database
If you have Operational Intelligence licensed and requested the plug-in to be activated per the getting started steps, then you likely have all you need to get going. However, something that may not be known is that Operational Intelligence eventually stores all this metric data in the platforms MetricBase application / database. The nice thing about Operational Intelligence is that it alleviates you needing to know much about the MetricBase application because it handles all the setup around metric registration, retention policies, storing the metric data, viewing the metric data, etc.
So why do I mention it? Viewing the MetricBase status is not in the OI module, so it's good to know that it has its own module for debugging and seeing status. If you requested the OI plugin to be activated, believe you have metrics coming into the instance correctly, but are not able to visualize them via something like Metric Explorer, then you may want to have support validate that the snc.com.clotho plugin is also activated as this represents the MetricBase application required for OI.
Step 5: Monitoring Registered Metrics
When you first connect AWS CloudWatch Metrics to your ServiceNow instance, a nice feature is that all the metrics will self-register within Operational Intelligence. This also results in a bit of an administrative task because you likely do not want all those metrics causing noise within your navigating the Anomaly map or Metric explorer. In my simple testing where I added a minimal number of custom metrics previously described, there were 140 metrics self-registered in my instance. You can see a list of AWS Metrics to get a better idea of what they deliver by default into CloudWatch.
It's easy enough to just go into the "Metric Types" list in OI and deactivate metrics you don't want in the instance. This also helps with processing time because the AWS connector is a pull connector and so we can cease with pulling and processing those metrics. Some important information on scaling with regards to how many metrics we can process can found in the docs here.
Step 6: Using the Data
At this point we should have our metrics flowing in and you can verify by looking at the same Events table that standard event management uses (em_event).
Raw Metric Events
Metric events do not, by default, become regular IT alerts as happens in standard event management. Instead, the OI application exposes "Anomaly Alerts" based on the learned boundaries calculated for each CI / Metric Type (e.g. instance-abc CPU utilization threshold range is calculated between 20-45% so create anomaly alerts when it falls outside that range).
Alert Anomalies
These alert anomalies are likely to open and close repeatedly (re-opening the same one) if metrics continually fall outside the calculated range. You can override the calculated ranges with Metric Classes, so alert anomalies are only created when the metric falls above or below your manually defined bounds. You can have these alert anomalies create actual IT alerts if you find them to be identifying issues you want actioned. This is done by going into the alert anomaly record and scrolling all the way to the bottom where you will see a "Promote anomaly alert" button to start the process.
In terms of other useful visualizations of the data, the Metric Explorer lets you quickly drag and drop one or more metrics onto a canvas that can instantly graph the metric(s) over a certain time period. Two of the metrics you can see below are our custom metrics of "MemoryUtilization" and "DiskSpaceUtilization".
Metric Explorer
The Anomaly Map provides a visualization that defaults to showing the "hottest" configuration items in terms of anomaly score and anomaly alert severity. However, you can create a CMDB group, pinned CI's, or even business services as the focus of the map. You can see our custom metrics of "MemoryUtilization" and "DiskSpaceUtilization" are being reflected.
Anomaly Map
Conclusions
There are numerous options for getting metrics into the Operational Intelligence application. In this post we were aiming to expose how to extend what AWS CloudWatch will send ServiceNow so that more comprehensive outage prevention can be obtained without 3rd-party tools. The collection of these metrics not only provides valuable anomaly detection capabilities based on powerful machine learning, but also lay the foundation for other capabilities when combined with other aspects of the ServiceNow platform. Imagine using Performance Analytics (PA) to score and store the daily average of important metrics that relate to capacity management. You could then set thresholds and apply forecasting models native to the PA application in order to obtain a proactive procurement cycle of critical infrastructure that may take weeks to deliver instead of being reactive and experiencing extended ou
- 10,663 Views
8 Comments
You must be a registered user to add a comment. If you've already registered, sign in. Otherwise, register and sign in.

