- Mark as New
- Bookmark
- Subscribe
- Mute
- Subscribe to RSS Feed
- Permalink
- Report Inappropriate Content
04-13-2022 05:41 AM
Hello,
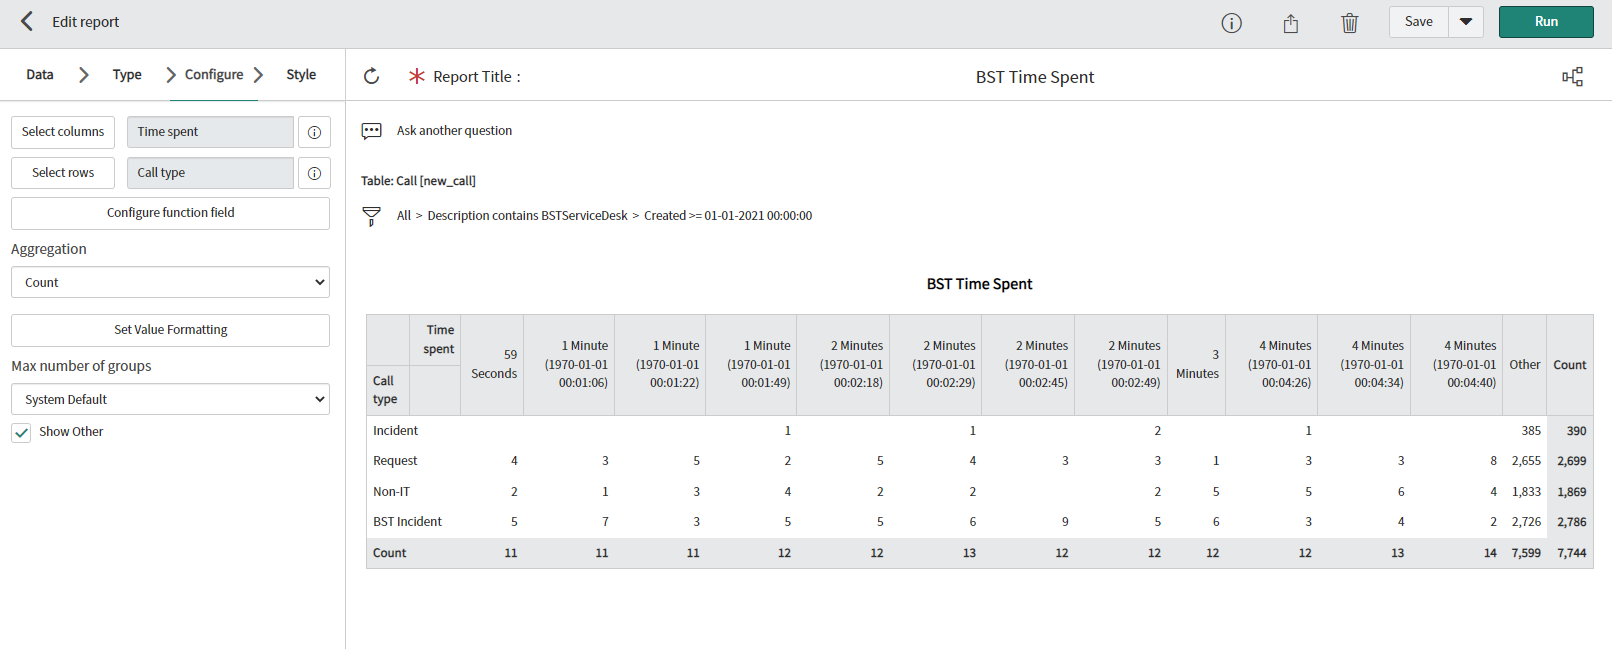
I am trying to create a report for some of our users that display how long it is taking for a Call to be transferred to either an Incident, Service Request or one of the other options. We have a field within the 'Call' table called 'Time Spent', however when reporting on this field, and choosing any graph option (but not a pivot table) it only breaks down the report into the following categories:

As you can see c7600 records are logged as 'Same Day' - would it be possible to instead show this by hours/minutes spent i.e., 15-30 minutes, 30minutes - 1 hour, 1 hour - 2 hours etc?
When showing as a Pivot table it breaks it down on a minute by minute basis which is the other end of the extreme and therefore not useful either.

Any help would be appreciated - thanks in advance.
Solved! Go to Solution.
- Labels:
-
Incident Management
-
Service Desk
- Mark as New
- Bookmark
- Subscribe
- Mute
- Subscribe to RSS Feed
- Permalink
- Report Inappropriate Content
04-13-2022 05:50 AM
Hi,
Can you use the Report Ranges and configure the time chunks for this table. Then it should show that.
- Mark as New
- Bookmark
- Subscribe
- Mute
- Subscribe to RSS Feed
- Permalink
- Report Inappropriate Content
04-13-2022 06:39 AM
Hi,
In Report ranges, I dont see a way to achieve it. But if its just between 30 min to 1 hr you want, you can add that as a condition in the filter condition as 'Time spent on relative between ( then select the timings you need). Give that a try .. you may use report ranges and on relative condition in condition builder to get your report ?