- Mark as New
- Bookmark
- Subscribe
- Mute
- Subscribe to RSS Feed
- Permalink
- Report Inappropriate Content
03-29-2024 04:04 AM
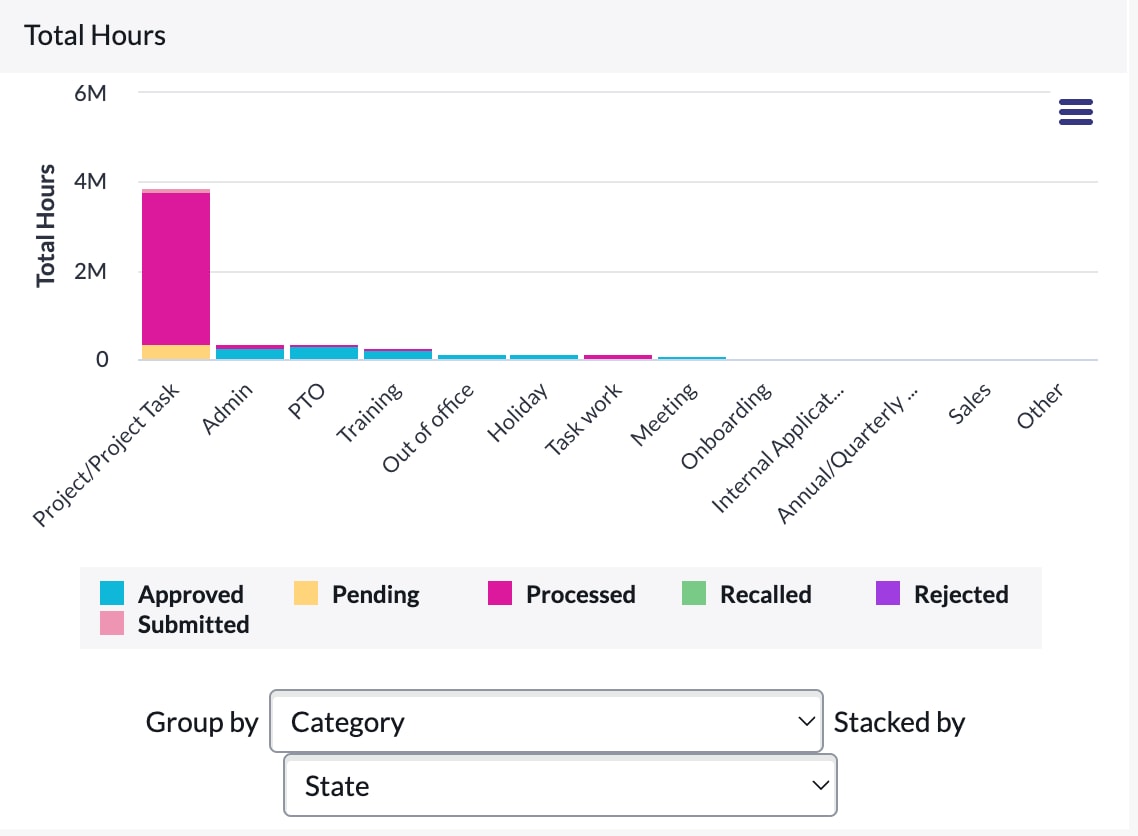
I want to create number of incidents created per week,month and year in which i can be able to toggle yearly,monthly and weekly report like i have attached in a single report
Solved! Go to Solution.
- Mark as New
- Bookmark
- Subscribe
- Mute
- Subscribe to RSS Feed
- Permalink
- Report Inappropriate Content
03-29-2024 05:14 AM - edited 03-29-2024 05:20 AM
Hi @rubesh_u,
Hope you are doing well
Proposed Solution
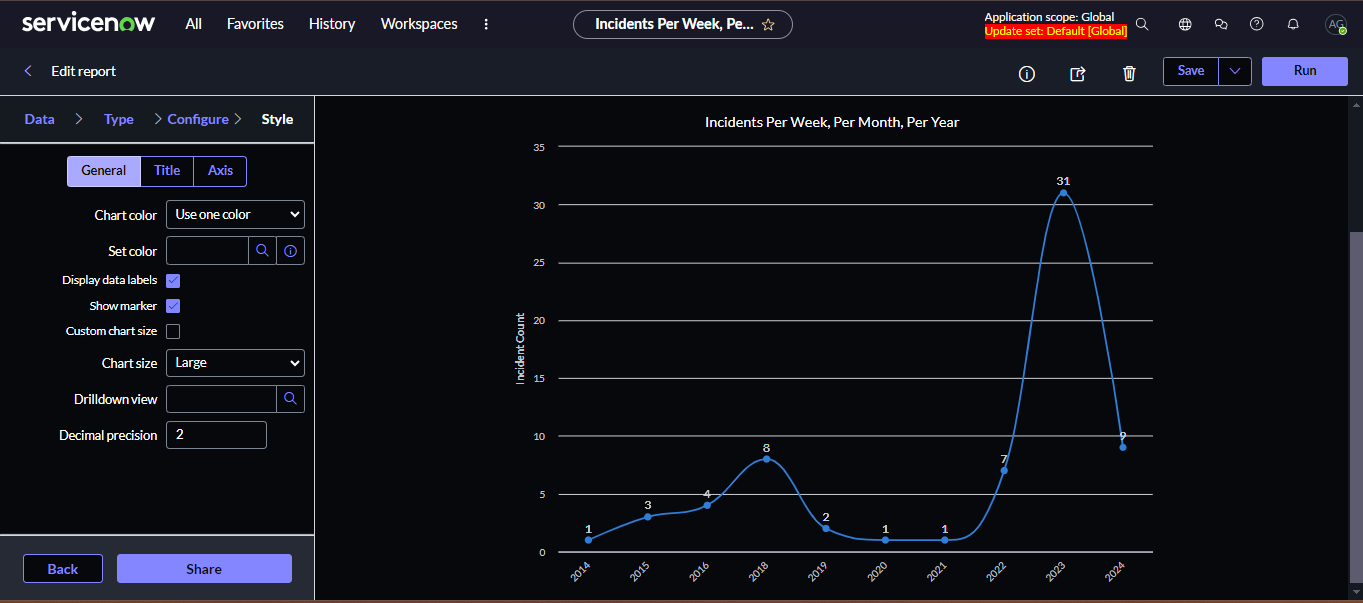
In order to achieve this task, you can have a look into "Add Dataset and Add Drilldown" feature in reports of ServiceNow. To offer the best approach and solution and get the solution as soon as possible, I tried to make it on my Personal Developer Instance and attached the screenshots of the outputs for the reference that will give you better insights of how the report seems to be visible and the best thing will be to follow the solution and try to create the same on your instance.
For the perspective of guidance, I attached the screenshot of the Dataset and Drilldown feature as a view that help you to create it on your instance.
How it works?
- You need to click on the datapoints for which you want to see the incidents created per month and then per week, if record exists.
- Displays data or details like Incidents Per Year > Per Month > Per Year after each and every click.
If you find this information/knowledge/solution helpful, Please don't forget to mark my solution and reply as helpful and accepted.
Thanks 🙂
Aakash Garg
ServiceNow Developer
- Mark as New
- Bookmark
- Subscribe
- Mute
- Subscribe to RSS Feed
- Permalink
- Report Inappropriate Content
03-29-2024 05:34 AM
Hi @Dr Atul G- LNG Sir,
Hope you are doing well and glad to see that my explanation seems interesting to you and marked my proposed solution as helpful. It would be my honor to let you know about it.
To make reports like this, you have to click on the top-right highlighted icon as displayed in the image down below.

If you find this information/knowledge/solution helpful, Please don't forget to mark my solution and reply as helpful and accepted.
Thanks
Aakash Garg
ServiceNow Developer
- Mark as New
- Bookmark
- Subscribe
- Mute
- Subscribe to RSS Feed
- Permalink
- Report Inappropriate Content
03-29-2024 05:56 AM
Thanks mate, I tried this, but not getting way how per month will appear.

Month and Test is still referring to Inc table without any filter. Do I need to create 2 new report and then add them in dril down?
Regards
Dr. Atul G. - Learn N Grow Together
ServiceNow Techno - Functional Trainer
LinkedIn: https://www.linkedin.com/in/dratulgrover
YouTube: https://www.youtube.com/@LearnNGrowTogetherwithAtulG
****************************************************************************************************************
- Mark as New
- Bookmark
- Subscribe
- Mute
- Subscribe to RSS Feed
- Permalink
- Report Inappropriate Content
03-31-2024 11:54 PM
Hi @Dr Atul G- LNG Sir,
Hope you are doing well.
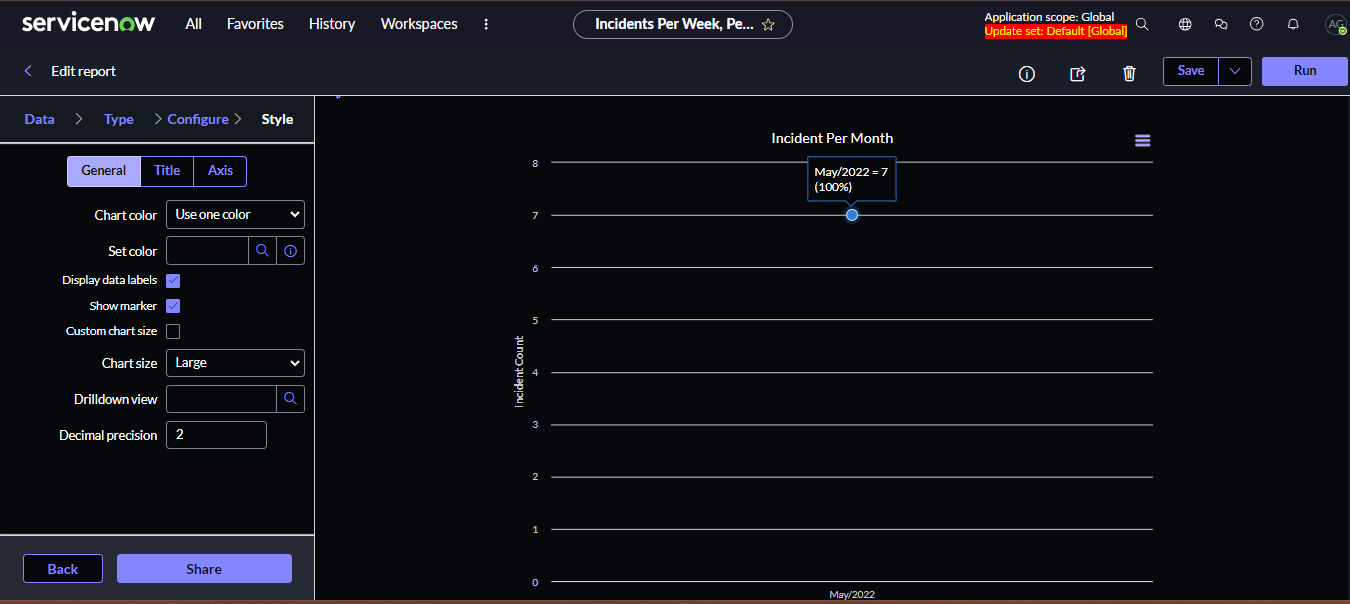
If you see my Drilldown under Report Structure - "Per Month and Per Week" are just the reports name. While adding Drilldown, you have to create reports as per your requirement like "If you want to create a report and show the data trend like "Incident Per Month", then you just have to click on the "Add Drilldown Option" and then you need to customize the report as per your requirement which is to show the data on a monthly basis. Similarly, For Week as well or whatever report, we want to make or show".

Hope you got it, Sir. If any help needed, we can setup a call via any medium to get it clear and resolved.
If you find this information/knowledge/solution helpful, please don't forget to mark my solution and reply as helpful and accepted.
Thanks :)
Aakash Garg
ServiceNow Developer
- Mark as New
- Bookmark
- Subscribe
- Mute
- Subscribe to RSS Feed
- Permalink
- Report Inappropriate Content
03-29-2024 05:30 AM
Hi @rubesh_u,
there are 2 ways.
1. Create seprate report.
2. if you need in a single report, make use of dataset and drilldown option on the top right corner of your report.
☑️ Please mark responses as HELPFUL or ACCEPT SOLUTION to assist future users in finding the right solution....

- Mark as New
- Bookmark
- Subscribe
- Mute
- Subscribe to RSS Feed
- Permalink
- Report Inappropriate Content
03-30-2024 05:29 AM
Hi @rubesh_u
- Best solution is to create a report of the incident table with the needed conditions.
- Add the new report to a dashboard
- Add a date interactive filter to the dashboard where you can select specified date range.
If my answer has helped with your question, please mark my answer as accepted solution and give a thumb up.
best regards
Anders
If my answer has helped with your question, please mark my answer as the accepted solution and give a thumbs up.
Best regards
Anders
Rising star 2024
MVP 2025
linkedIn: https://www.linkedin.com/in/andersskovbjerg/