Updating Chart Colors Not Working
- Mark as New
- Bookmark
- Subscribe
- Mute
- Subscribe to RSS Feed
- Permalink
- Report Inappropriate Content
11-05-2015 11:01 AM
Hey All,
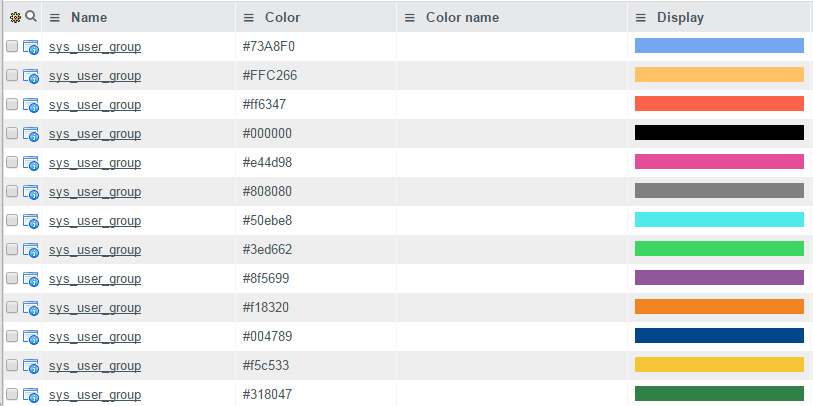
I have a bar graph sorted by the classification of the assignment group. I went to the Chart Colors module in Reports and updated each value from the element of classification.

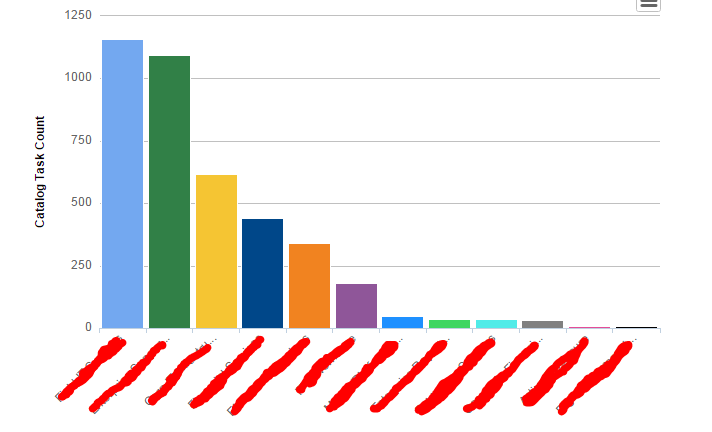
However, when I run the report the colors are associated with the wrong classifications.

For a specific example. The second bar which is green is actually supposed to be blue for that classification I had specified in the chart colors. The classification field on the group table is a drop down and I made sure the values matched. I attempted logging out/in and clearing my cache but to no avail. Has anyone experienced this before?
- Mark as New
- Bookmark
- Subscribe
- Mute
- Subscribe to RSS Feed
- Permalink
- Report Inappropriate Content
11-05-2015 02:56 PM
Are all the colors not matching correctly, or is it only some of them? We have a known Problem tracked in PRB650062 that leads to similar symptoms, but it was only reported as occurring when the color hex begins with "#0F". This may be in scope with the Problem, and there may be further symptoms of this than was found in the initial report. The Problem is still pending so we have not tracked the cause yet. You may want to get in touch with Support to see if they can confirm if this is related.
- Mark as New
- Bookmark
- Subscribe
- Mute
- Subscribe to RSS Feed
- Permalink
- Report Inappropriate Content
11-09-2015 06:25 AM
Interesting. I logged an incident with support. Thanks for the heads up.
- Mark as New
- Bookmark
- Subscribe
- Mute
- Subscribe to RSS Feed
- Permalink
- Report Inappropriate Content
11-05-2015 05:33 PM
Hi Tony,
I am sure you have already looked at this however: Configuring Chart Colors - ServiceNow Wiki
This outlines that you have to set the Chart Colours to the table you are reporting on. Here it looks like you are reporting on the Catalog Tasks by Sys User Group.
Try updating the colours on the catalog task element and lets see how that goes?
- Mark as New
- Bookmark
- Subscribe
- Mute
- Subscribe to RSS Feed
- Permalink
- Report Inappropriate Content
06-09-2016 12:15 PM
Tony,
Did you get your chart colors working?
I have a report that runs on the Task_sla table. I calculate the average Actual Time grouped by Priority.
The priority comes from the Task table itself. However, when I change the chart color for priority =2 to 'red', i still get green. Grrrrr.
Maybe chart colors only work for columns directly in the table, not a parent
Matthew