Weight for surveys metrics categories
- Mark as New
- Bookmark
- Subscribe
- Mute
- Subscribe to RSS Feed
- Permalink
- Report Inappropriate Content
05-30-2025 06:52 AM
Hi guys,
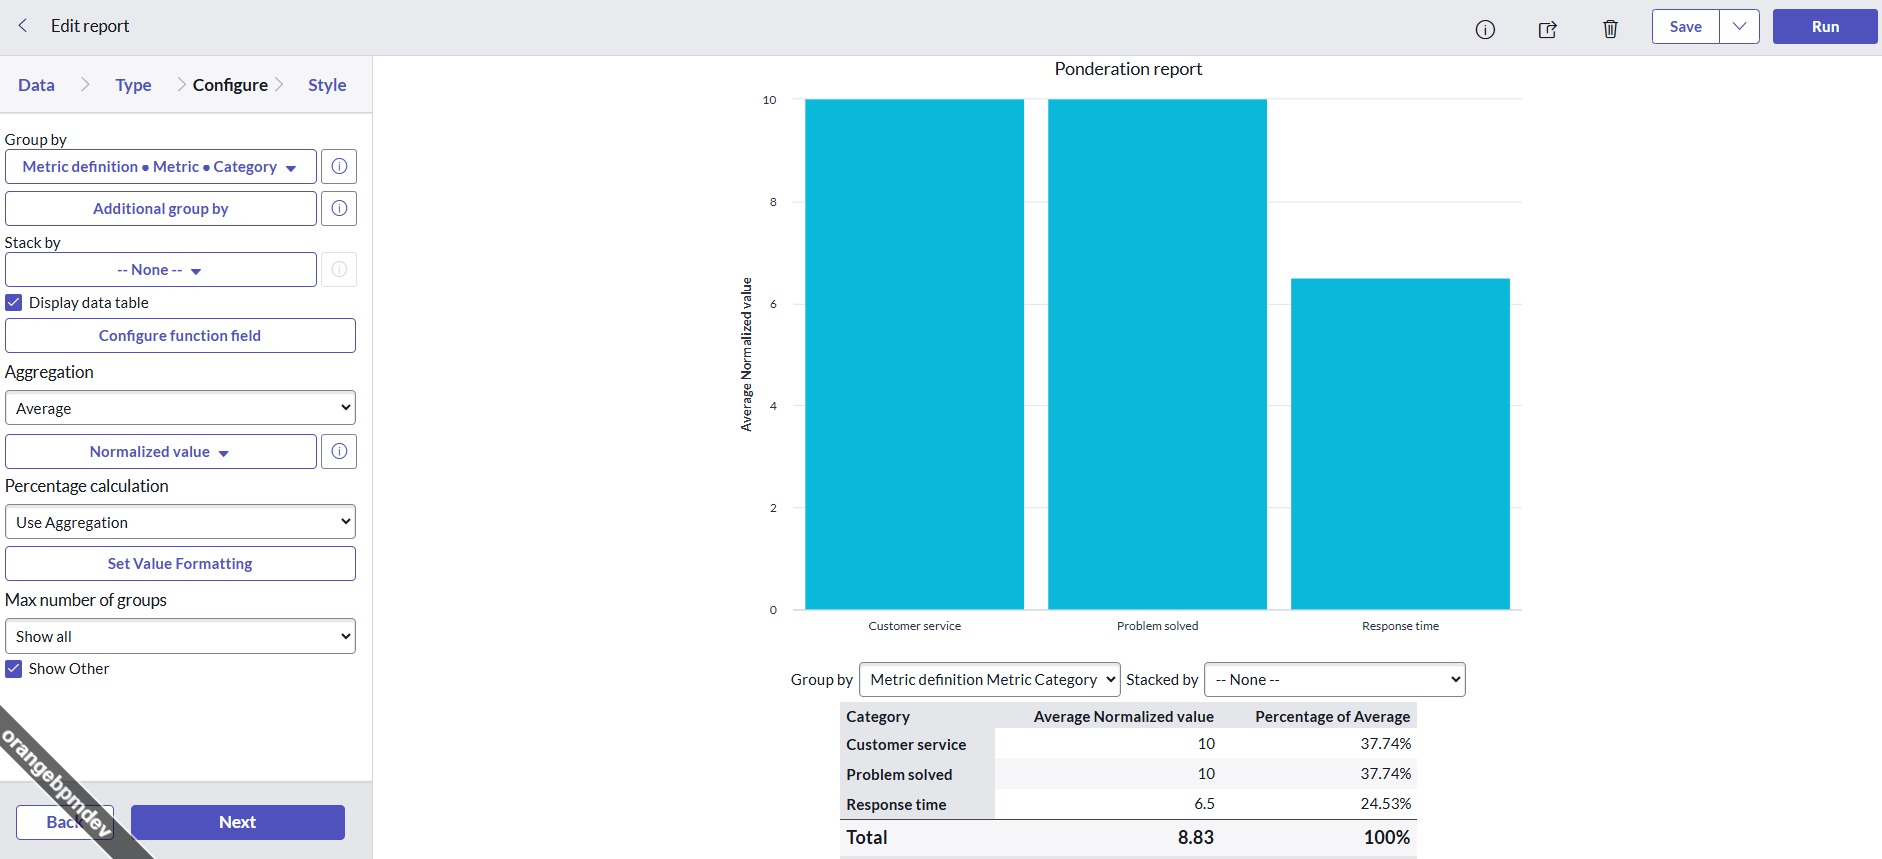
I did created a basic survey to visualize how weight works, I know how it works but the values are not showing on the report (it should be score responses for the categories multiplied by percentage)
In the use case I created it: 70% for response time (scale is from 0 to 10 for each category)
20% for problem solved question
10% for customer service
any idea on how to show it via a report, please, do not hesitate 🙂
Thanks,
PS: Attachment below
- Mark as New
- Bookmark
- Subscribe
- Mute
- Subscribe to RSS Feed
- Permalink
- Report Inappropriate Content
05-31-2025 11:15 PM
Hello @Amir_23,
asmt_metric_results table and related reports.
- Navigate to Survey Management > Survey Definition and select the survey you want to modify.
- Edit the survey definition and go to the Category Weights section.
- Enter the desired weight for each category. The system calculates the overall survey score based on these weights.
-
Pre-built Scorecards:ServiceNow provides out-of-the-box scorecards that display survey results, including category and question-level details.
-
Custom Reports:You can create custom reports using the
asmt_metric_resultstable to visualize survey results in different ways. -
Navigate to Survey Management > View Surveys.Select your survey, and then click "View Scorecard" to see pre-made reports.
-
Filter by Category:You can switch between "Category Results" and "Question Results" in the scorecard to view different aspects of the survey data.
asmt_metric_results table:The asmt_metric_resultsThe table stores the results of each survey response, including calculated values based on category weights.- You can use this table to create reports, dashboards, and visualisations to analyse survey data.
- Mark as New
- Bookmark
- Subscribe
- Mute
- Subscribe to RSS Feed
- Permalink
- Report Inappropriate Content
06-02-2025 01:22 AM
Hi @abbasshaik4
Thank you for prompt reply, I already did all above before posting this questions.
So far I don`t see the difference between average answers and weighted ones, and objective is to show
the differences between them. I did the calculation and it is the same.
Checked all documentation about weight and the are limited to put the weight in the survey definition.
If you did try something different, please, let me know
Thanks,