- Post History
- Subscribe to RSS Feed
- Mark as New
- Mark as Read
- Bookmark
- Subscribe
- Printer Friendly Page
- Report Inappropriate Content
on 07-19-2020 05:19 AM
Introduction
This article explains how you can take advantage of the new mobile features about reporting.
If you are a newbie, you feel uncomfortable with new ServiceNow mobile technology, or even you are not familiar with Studio, I strongly recommend you to read the next resources prior to start:
- Mobile Configuration and Navigation on documentation
- Mobile Development Fundamentals (Orlando) on NowLearning
- Mobile Applications on Developer site
- How Studio Works
I assume that you have the right foundations about ServiceNow technology, and specifically the Mobile approach.
Last, can be interesting read the first part of this article.
Expected Working time: 120 minutes
Where we are
In the first article we created an incident dashboard, but there is no detail neither access to the data, so let’s fix that! This is the plan:
- Create the Chart for the Latest Score and Time Series and their navigation
- Create only one applet list of incidents for all the reports
- Create the navigation and update all the reports
- Have fun!
Create Chart Applets
Well, maybe you are confused. Didn’t we do this in the previous article? Answer is No, we created the Preview Chart, do you remember? So now we are going to configure two new Applet Chart, one per the Active Major Incident (Latest Score), and one per Open Incident per Category (Time Series). Keep in mind that Single Score has not detail, there is not more info to show, it is a Single Score!
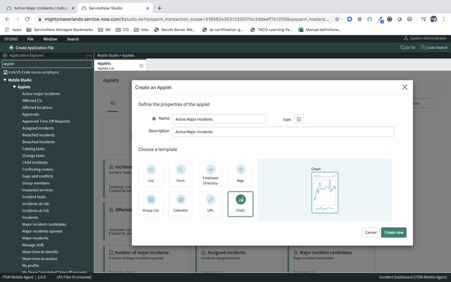
To do that, we open the applets list and press over Create an Applet:

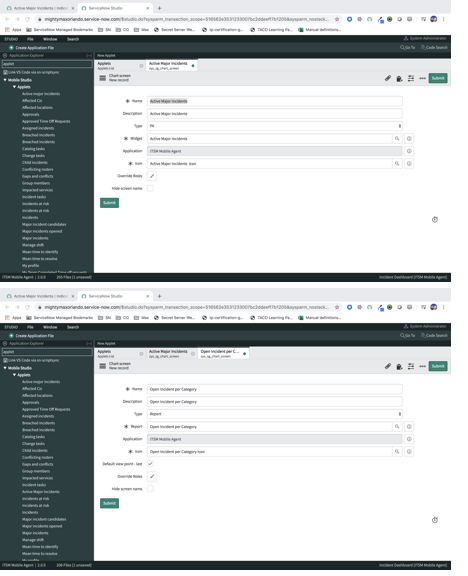
Introduce the name and choose type Chart:

Introduce the information:
- Active Major Incidents (Latest Score)
- Name: Active Major Incidents
- Description: Active Major Incidents
- Type: PA
- Widget: Active Major Incidents
- Open Incident per Category (Time Series)
- Name: Open Incident per Category
- Description: Open Incident per Category
- Type: Report
- Report: Open Incident per Category


Now we are going to create the navigations, once per each applet report:

- Active Major Incidents (Latest Score)
- Name: Jump to Active Major Incidents
- Description: Jump to Active Major Incidents
- Context: Global
- Destination Type: Applet
- Destination: Active Major Incidents
- Open Incident per Category (Time Series)
- Name: Jump to Open Incident per Category
- Description: Jump to Open Incident per Category
- Context: Global
- Destination Type: Applet
- Destination: Open Incident per Category


Now we have to introduce these new navigations in the correspondent chart previews:
- Active Major Incidents -> Jump to Active Major Incidents
- Open Incident per Category -> Jump to Open Incident per Category


Let’s check how it works!

Now we have a much more interesting Dashboard, but still having one problem, how can we go to the data?
Create Incident Applet List
I know what you are thinking: “why we need to create an Applet List for Incidents if OOTB I have several of them?” OK, let me answer to that: an Applet List has one and only one Data Item (source of data), so if the Data Item is different, the Applet List must be different, and as you can guess, the OOTB Incident Data Items are different from our reports.
So, the usual second question is “So do we need one Applet List for every single report?”, fortunately the answer is no, you don’t need it.
Let’s create the Data Item first. Navigate to the List and press over Create New:

Introduce this info:
- Name: Incidents by Encoded Query Data Item
- Table: Incident
- Description: Incidents by Encoded Query Data Item
- Condition Type: Append Encoded Query
- Append Encoded Query: Left blank

After saving the new Data Item, add a new parameter called URL, type String and add it as Append Encoded Query:


Once is saved, you can navigate to the list of applets to create a new one.
Introduce this information for the new Applet List (Remember that this is for a demonstration purpose, please, put an appropriate business name to your applets)
- Name: Incidents by Encoded Query
- Description: Incidents by Encoded Query
- Form: Selected

Because the key target of this article is about the dashboard and not core functionality, let’s keep it simple:
- List Screen
- Data Item: Incidents by Encoded Query Data Item
- Pattern: By default
- Fields: Whatever you want, I selected Priority, Number, Short Description, State, Caller Avatar, and Caller.
- Form Screen: Replicate from primary
Save it, and add an Autofill Parameter Definition, with name URL (name can be whatever you want, but I think that is a good idea to use the same of the Data Item), and Input Type Append Encoded Query.
Last, create the Screen UI Parameter Mapping:
- Item Parameter: URL
- UI Parameter: URL
Now you are thinking “Wow, this is awesome, lovely, but how can the applet be test it?” Ok, do you remember our Single Scores? We leave on the Chart Preview the “Jump to screen” blank intentionally, so what we need to do is a new navigation:
- Name: Drill down to Incidents
- Description: Drill down to Incidents
- Context: Global
- Destination Type: Applet
- Destination: Incidents by Encoded Query

Notice that the parameter URL is automatically created once you save, and actually you are not going to see it more in Studio: it is the secret sauce that makes the magic happens! Don’t touch it!
Now we have to add the navigation “Drill down to Incidents” to our Chart Previews, Open Incidents and Overdue Incidents:

Let’s try it!

But what about our Applet Graphs? They don't have this “Jump to screen”... field Unfortunately today is not possible to navigate from a PA (Active Major Incidents in our example) to the info, but for the Time Series (Open Incident per Category in our case) we can use a slightly different strategy. We need to create a Function in order to use the navigation “Drilldown to Incidents”. To do that, you have to open the Applet report “Open Incidents per Category” and create a new Function Instance.
Introduce the info:
- Label: Go to info
- Location: Chart Screen Header
- Function: Drill down to Incidents

Notice how the header of the graph changes, appearing a little icon on the header.
Tabbing over the new icon, we can navigate now to the same Applet List that we created previously (one for all all for one!).
Have fun!
Now you have a perfect dashboard with full functionality and easy maintenance, since you only need one Applet List for table with the Append Encoded Query technique.
Remember, this is a No Code approach, the number of script lines that I needed to create this as a developer has been zero!

Umm… well, everything looks cool, but what about an interactive filter? Short answer: It is not possible, Long answer: read this article 🙂
- 95,989 Views
- Mark as Read
- Mark as New
- Bookmark
- Permalink
- Report Inappropriate Content
Hi Max,
do you know if there are any limitations in number of displayed charts in Chart Previews in Applet Launcher?
I can only show in Applet Launcher one time-series report.
If I create more UI sections with time-series reports, I can always see only the report from the highest UI section.
Not sure if it's issue of my Bluestack emulator I'm using for testing or if it's a general limitation.
- Mark as Read
- Mark as New
- Bookmark
- Permalink
- Report Inappropriate Content
Hi
Thanks for reading my articles 🙂
As far as I know, no. I did a very quick test with two reports and both are shown, so maybe it is your emulator, or maybe there is something wrong in your instance.
Hope it helps!
Max.
