Change the default "group by" for a report
- Mark as New
- Bookmark
- Subscribe
- Mute
- Subscribe to RSS Feed
- Permalink
- Report Inappropriate Content
07-27-2017 02:39 AM
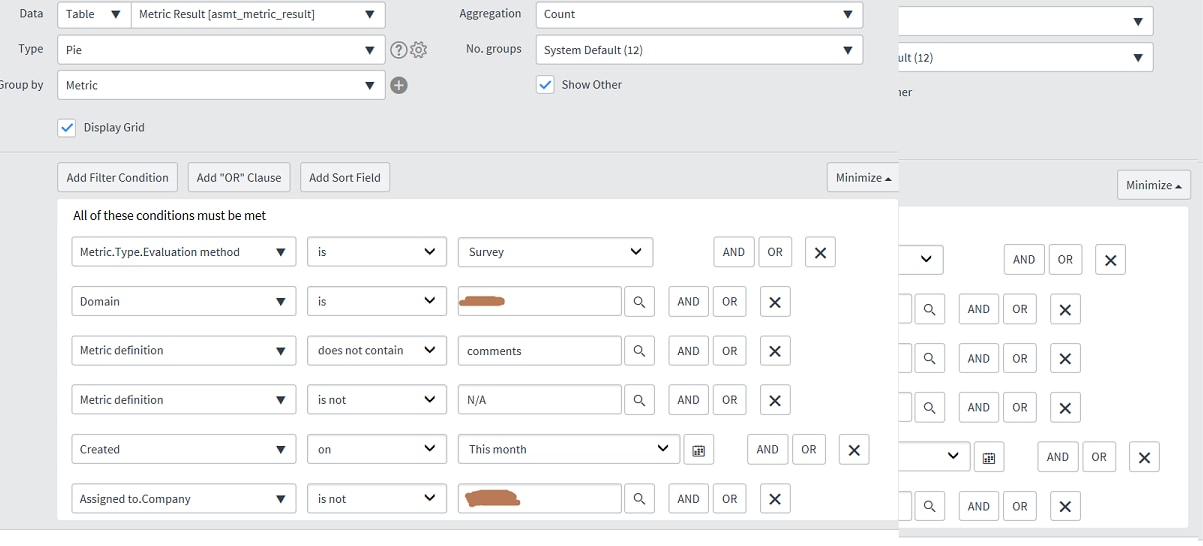
On our Helsinki system, we have a report on our customer satisfaction surveys which is defined as follows:

When we run the report, we see our pie chart, as expected:

In the box below the graph as shown, is a drop-down list with two options in it, "Metric" (the default) and "String value". Selecting the "String value" option gives us the data we really want, which is the percentage of "Strongly agree", "Agree", etc, answers to the survey questions:

This works fine when we run the report manually, but what we actually want to do is to schedule the report, and email the chart as a PDF. Obviously when we do this, what we get is the default grouping option of "Metric". We need to have "String value" as the default grouping option, but "String value" does not appear in the list of grouping options in the "Group By" list in the report definition!
Can anyone help us obtain the result we want, and get a report which is grouped by "String value" by default, please?
Many thanks,
Chris
- Mark as New
- Bookmark
- Subscribe
- Mute
- Subscribe to RSS Feed
- Permalink
- Report Inappropriate Content
07-27-2017 03:20 AM
Hi Chris,
Since you say when you manually run the report it populates what is expected. Could you confirm if you do a simple run or you Save it first & then run the report.
- Mark as New
- Bookmark
- Subscribe
- Mute
- Subscribe to RSS Feed
- Permalink
- Report Inappropriate Content
07-27-2017 04:07 AM
Thank you, Jaspal, but you misunderstand the issue.
The problem is that the customer has to manually run the report; it comes up initially with "Metric" as the group by option, and in order to get the data they want, they have to change the "Group by" option from "Metric" to "String value". We want the report to come up grouped by "String value" as the default, but we can't find a way to do this.
Hope this clarifies the issue,
Chris
- Mark as New
- Bookmark
- Subscribe
- Mute
- Subscribe to RSS Feed
- Permalink
- Report Inappropriate Content
07-27-2017 03:31 AM
Chris Marriott wrote:
This works fine when we run the report manually, but what we actually want to do is to schedule the report, and email the chart as a PDF.
Why? You've already created the report.
Could you add it to a dashboard so that report audience come and view the most up-to-date data, rather than receive an email containing static (and possibly outdated) information?
If you want a report that has a static view, I'd recommend copying the report to another, remove the grouping options and fix it to a specific set of options - i.e. a singular view. This can then be scheduled to be sent (but static copies like this lose the dynamic filtering/grouping ability plus time-related accuracy).
- Mark as New
- Bookmark
- Subscribe
- Mute
- Subscribe to RSS Feed
- Permalink
- Report Inappropriate Content
07-27-2017 04:09 AM
Thanks for the reply, Dave. I agree with you that a dashboard would be a good solution (and in fact the report already does appear on a homepage), but we've been asked to do this by the customer, so I need to find out whether what they're asking for can be done. If it can't be, that's fine, and I'll go away and tell them that.
Cheers,
Chris
