How to create an incident aging dashboard.
- Mark as New
- Bookmark
- Subscribe
- Mute
- Subscribe to RSS Feed
- Permalink
- Report Inappropriate Content
09-13-2018 12:02 PM
Hi,
I got requirement to create dashboard on below time interval. Kindly suggest.
<1day
1-7 days
8-14 days
15-30 days
30+ days.
Please suggest/refer is there any document available for the same.
- Labels:
-
Dashboard
- Mark as New
- Bookmark
- Subscribe
- Mute
- Subscribe to RSS Feed
- Permalink
- Report Inappropriate Content
10-02-2018 12:15 PM
Hi,
Thanks for the above information. But I am not getting Bucket Groups option under breakdown!!
Any suggestions
- Mark as New
- Bookmark
- Subscribe
- Mute
- Subscribe to RSS Feed
- Permalink
- Report Inappropriate Content
10-02-2018 12:21 PM
In the left nav if you search for Bucket Groups you aren't seeing anything? It should be a link under PA --> Breakdowns.
Do you have the full PA suite? Or are you using the free trial/incident version?
- Mark as New
- Bookmark
- Subscribe
- Mute
- Subscribe to RSS Feed
- Permalink
- Report Inappropriate Content
10-02-2018 12:33 PM
Yeah I got that.
But my requirement is bit different.
We have two different kind of Incidents i,e GTS and CMS. Segregated based on customized field Service Type.
I need to create a Aging dashboard for CMS incidents and I am pretty new to this dashboard concept.
Not getting how to achieve this!!
It would be really helpful if you can provide any doc for the same. Thanks in Advance!
- Mark as New
- Bookmark
- Subscribe
- Mute
- Subscribe to RSS Feed
- Permalink
- Report Inappropriate Content
10-02-2018 01:04 PM
You should still be able to create the bucket categories, they are not specific to any filters or fields.
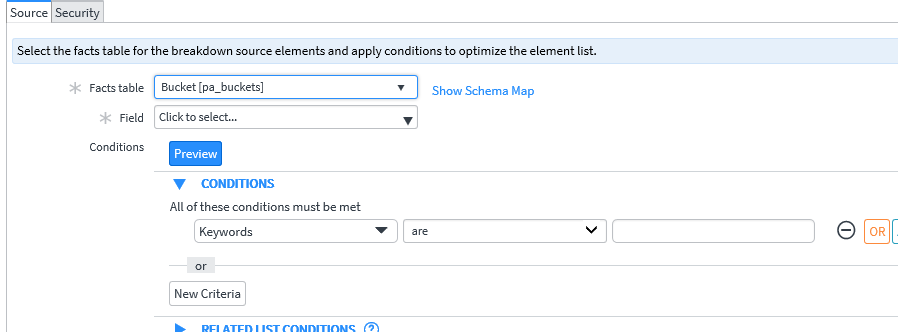
Then you'd create a breakdown source and use the Bucket group you created for the facts table in the breakdown source.
You'd then create an indicator source and then the indicator - point it to the indicator source and add the breakdown that's using the bucket groups. You can add your specific filter at the indicator level.
I know there are a lot of pieces to this and it took me months to grasp this.
1. create bucket group
2. create breakdown source (facts table = the bucket group)
3. create breakdown based on the breakdown source
4. create indicator source
5. create indicator - add your filter for the incidents you want to see - and add breakdown
This might help too: https://docs.servicenow.com/bundle/london-performance-analytics-and-reporting/page/use/performance-analytics/concept/c_BucketGroups.html

- Mark as New
- Bookmark
- Subscribe
- Mute
- Subscribe to RSS Feed
- Permalink
- Report Inappropriate Content
10-02-2018 01:18 PM
Thank You So much. I will start working on this and inform you!