- Mark as New
- Bookmark
- Subscribe
- Mute
- Subscribe to RSS Feed
- Permalink
- Report Inappropriate Content
12-07-2018 06:21 AM
Hi Community
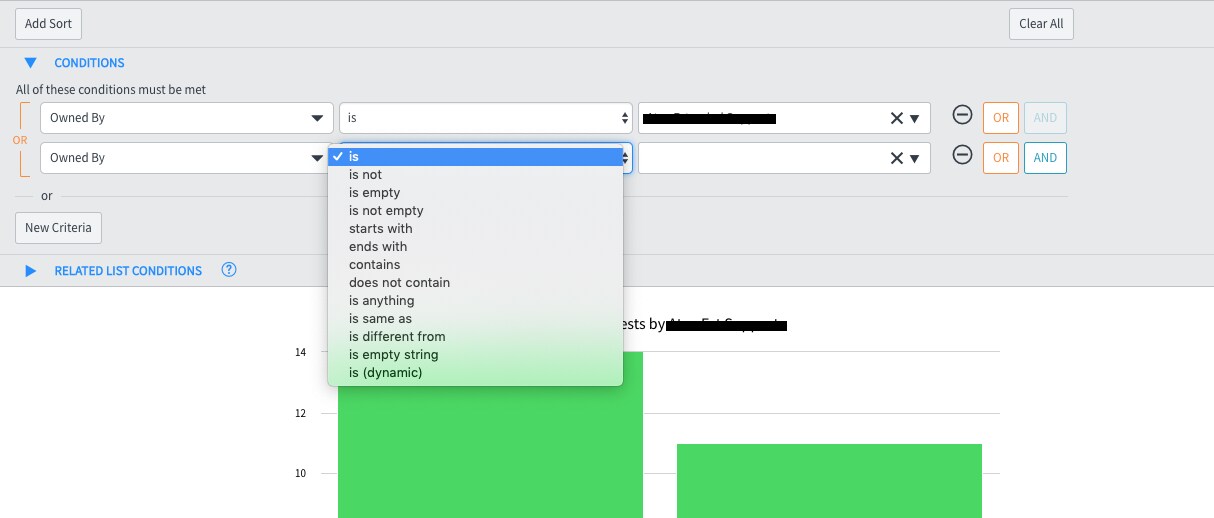
I'm trying to create a report that show Incidents and Requests tickets for a certain owner group. So far so good, but I also would like to show the tickets if the Owned By Was that group. I cannot find such operator.

Why I want this is because they are still relevant for the report even if they escalate it to another group. When they escalate it to someone else they disappear from the report since the tickets are no longer part of their owner group. I would still like to see those tickets in the report somehow.
How would I do this? Any other ideas on how to solve this?
Solved! Go to Solution.
- Labels:
-
Reporting
- Mark as New
- Bookmark
- Subscribe
- Mute
- Subscribe to RSS Feed
- Permalink
- Report Inappropriate Content
12-07-2018 07:43 AM
There's another alternative, at least for Incident. We actually have out of the box Metrics against Assignment Group and Assigned to on Incident that log each different value of that field, start, stop and duration. If you look in the metric_instance table, you can see them.
Better yet though, there's an out of the box Database View called incident_metric, which works like a table join, that connects Metric Instance table to the Incident table, to create a row for each one with all the data of each.
So if you do a report against the incident_metric table, then you add a filter for Metric Definition is Assignment Group, then the Group name you're looking for will appear in the "Value" field. That part works on the metric_instance table as well, but by using incident_metric, you also have access to all of the normal Incident fields for the incident.

One reason that this is better than using PA for this, is that PA will only be storing the Assignment Group that has the record at the time the job runs - so if an incident bounces between 3 teams in a day, PA will only show you the last one, where metric_instance/incident_metric will show you all 3, along with how long it was assigned to each one. Note value is different than Assignment Group in the list below:

Another neat trick you can do with metrics (the data in my demo instance isn't so good, but hopefully you'll get the idea) is the Metrics Timeline.

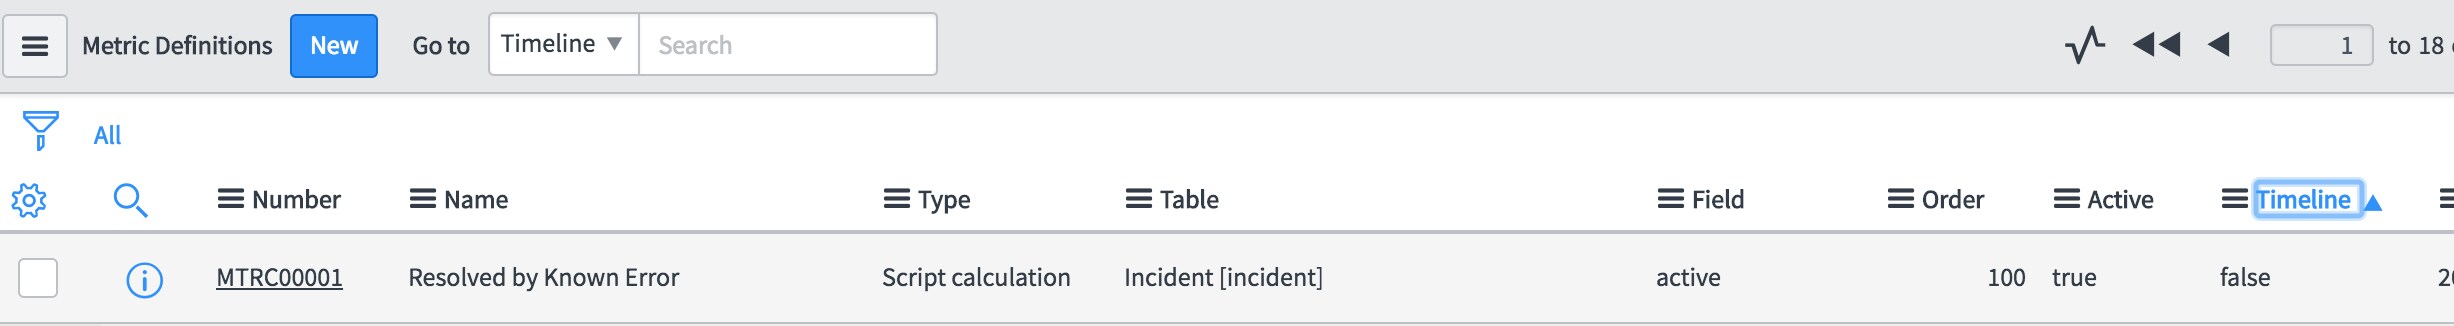
If you go into the Metrics - Definitions list and set "Timeline" to "True" for Assignment Group (it's false as-delivered). Then that metric will show up (retroactively, as long as the metric itself has been active!) on the Metrics timeline on the Menu in Incident:

Here's the Metrics Timeline:

What's cool about this, is combined with other Metrics, like Incident State duration, this lets you see very quickly for an Incident, which Assignment group it was assigned to when the State changed. In this example we can see that Database Atlanta had it for a long time before it was reassigned to several other groups and back to them. During the whole time, the State has been left in New.
But for example, if you have incidents that are active for long periods of time, that TECHNICALLY don't breach SLAs because they were listed as On Hold or Awaiting Customer or Awaiting Vendor, you can see the Group, (or the User if you add "Assigned To Duration" metric to the timeline) that put them on Hold in the first place.
That may help you determine if there's a flaw or loophole in the process that contributes to long Incident resolution times even if it's technically not an SLA violation due to the way it's configured. For example, if On Hold pauses the SLA, then technically I could have a Critical Priority Incident that's been active for 30 days that doesn't breach the SLA. Now, I know how to improve my process and I have an opportunity to train my staff on the correct way to do things.
Metrics timeline is cool because trying to visualize that same information manually in a report would be very difficult.
- Mark as New
- Bookmark
- Subscribe
- Mute
- Subscribe to RSS Feed
- Permalink
- Report Inappropriate Content
12-07-2018 06:40 AM
You can add field and store WAS value for that purpose adding there old group when assigning to another.
You can also use PA reporting where you store historical data but in this case you will see i.e. group from yesterday.
- Mark as New
- Bookmark
- Subscribe
- Mute
- Subscribe to RSS Feed
- Permalink
- Report Inappropriate Content
12-07-2018 06:49 AM
Adding a new field seems like the easiest solution for this. Thanks!
- Mark as New
- Bookmark
- Subscribe
- Mute
- Subscribe to RSS Feed
- Permalink
- Report Inappropriate Content
12-07-2018 07:43 AM
There's another alternative, at least for Incident. We actually have out of the box Metrics against Assignment Group and Assigned to on Incident that log each different value of that field, start, stop and duration. If you look in the metric_instance table, you can see them.
Better yet though, there's an out of the box Database View called incident_metric, which works like a table join, that connects Metric Instance table to the Incident table, to create a row for each one with all the data of each.
So if you do a report against the incident_metric table, then you add a filter for Metric Definition is Assignment Group, then the Group name you're looking for will appear in the "Value" field. That part works on the metric_instance table as well, but by using incident_metric, you also have access to all of the normal Incident fields for the incident.
One reason that this is better than using PA for this, is that PA will only be storing the Assignment Group that has the record at the time the job runs - so if an incident bounces between 3 teams in a day, PA will only show you the last one, where metric_instance/incident_metric will show you all 3, along with how long it was assigned to each one. Note value is different than Assignment Group in the list below:
Another neat trick you can do with metrics (the data in my demo instance isn't so good, but hopefully you'll get the idea) is the Metrics Timeline.
If you go into the Metrics - Definitions list and set "Timeline" to "True" for Assignment Group (it's false as-delivered). Then that metric will show up (retroactively, as long as the metric itself has been active!) on the Metrics timeline on the Menu in Incident:
Here's the Metrics Timeline:
What's cool about this, is combined with other Metrics, like Incident State duration, this lets you see very quickly for an Incident, which Assignment group it was assigned to when the State changed. In this example we can see that Database Atlanta had it for a long time before it was reassigned to several other groups and back to them. During the whole time, the State has been left in New.
But for example, if you have incidents that are active for long periods of time, that TECHNICALLY don't breach SLAs because they were listed as On Hold or Awaiting Customer or Awaiting Vendor, you can see the Group, (or the User if you add "Assigned To Duration" metric to the timeline) that put them on Hold in the first place.
That may help you determine if there's a flaw or loophole in the process that contributes to long Incident resolution times even if it's technically not an SLA violation due to the way it's configured. For example, if On Hold pauses the SLA, then technically I could have a Critical Priority Incident that's been active for 30 days that doesn't breach the SLA. Now, I know how to improve my process and I have an opportunity to train my staff on the correct way to do things.
Metrics timeline is cool because trying to visualize that same information manually in a report would be very difficult.
- Mark as New
- Bookmark
- Subscribe
- Mute
- Subscribe to RSS Feed
- Permalink
- Report Inappropriate Content
12-13-2018 01:14 AM
Thanks for this answer, metrics it is!