Throughput graph
- Mark as New
- Bookmark
- Subscribe
- Mute
- Subscribe to RSS Feed
- Permalink
- Report Inappropriate Content
05-31-2025 11:32 AM
- Mark as New
- Bookmark
- Subscribe
- Mute
- Subscribe to RSS Feed
- Permalink
- Report Inappropriate Content
06-01-2025 01:17 AM
No context provided.
No detailed information given.
No requirement explained.
So how should we answer to something like this?
Maik
- Mark as New
- Bookmark
- Subscribe
- Mute
- Subscribe to RSS Feed
- Permalink
- Report Inappropriate Content
06-01-2025 06:15 AM
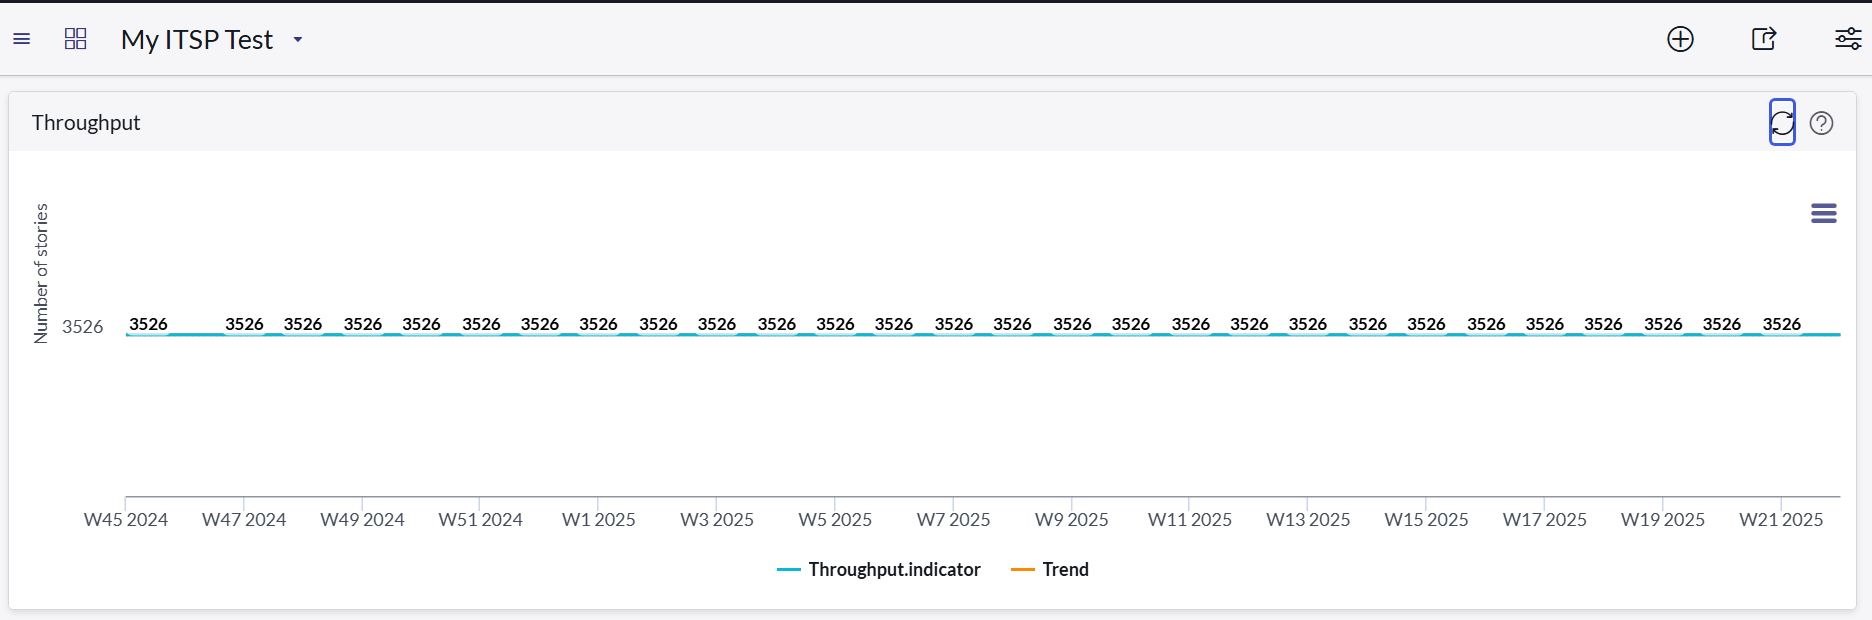
@Maik Skoddow I am not sure if are able to see the attachment in case not, let me explain you, I want to create a throughput graph to see no. of stories completed per weekbut instead of that same no. of stories is showing for every week. can you please help here what could be reason of that or may be I missed any step. what I have done so far
1. Created indicator source choosed weekly frequency.
2. Created Automated indicator and added source indicator, condition added "state is closed".
3. Created data collection jobs and executed.
4 Created widget and added to dashboard.
- Mark as New
- Bookmark
- Subscribe
- Mute
- Subscribe to RSS Feed
- Permalink
- Report Inappropriate Content
06-01-2025 07:31 PM
Hi @Saroj-bhard
you don't need a PA job for this as alll the required information is already available in the story records itself, because they contain a field "Closed" (closed_at) which can be configured for a simple data visualization:

Maik
- Mark as New
- Bookmark
- Subscribe
- Mute
- Subscribe to RSS Feed
- Permalink
- Report Inappropriate Content
06-01-2025 08:00 PM
Thank you for quick solution. I do not see these options on my Dashbord on right hand side seems like I do not have access to this hence if any alternative way you suggest would be great. Thanks again.